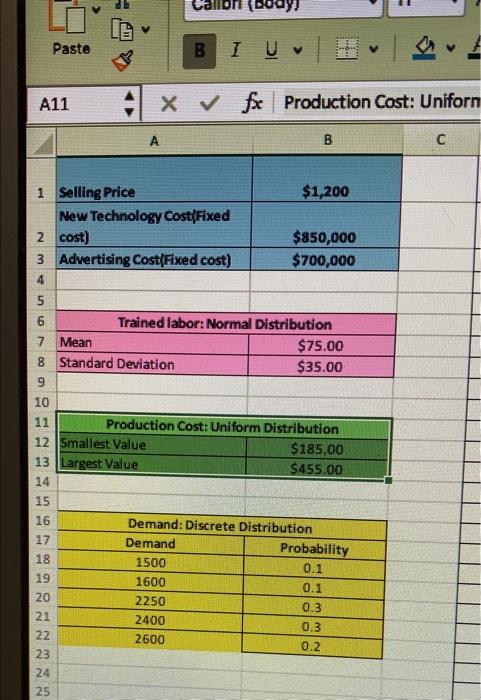
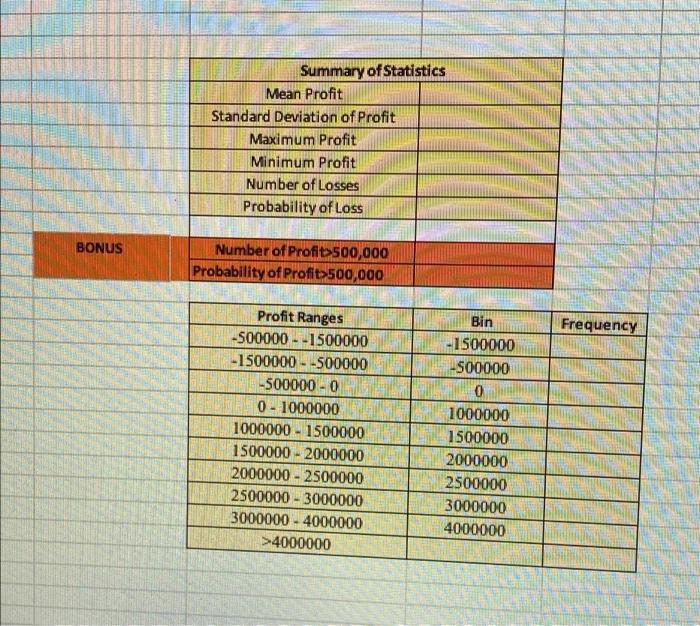
Question: Note: please solve it in excel and please show all the formulas and solver. please solve it fast pleaseeeee West Coast Health Corp, develops new

Note: please solve it in excel and please show all the formulas and solver.
please solve it fast pleaseeeee
Note: please solve it in excel and please show
West Coast Health Corp, develops new probiotic food ingredients. They developed a prototype of a new organic material which can substitutes unhealthy oil. They have performed preliminary marketing and financial analysis to determine their target customers. Following parameters are determined with certainty: Selling price= $1200/ton New technology cost= $ 850,000 Advertising cost= $700,000 The cost of a trained worker follows a Normal Distribution with the mean $75 per ton and the standard deviation $35 per ton. The large-scale production cost follows a Uniform Distribution with smallest value $185 per ton and the largest value $455 per ton. They are expecting a limited market for the first-year demand. Thus, the first-year demand follows a Discrete Distribution as follows: Demand (ton) Probability 0.1 1500 1600 2250 2400 2600 0.1 0.3 0.3 0.2 a) Develop a simulation model in the template for 200 trials. b) Fill the summary of statistics in your file. c) Plot the histogram for the specified ranges of profit. Bonus Question: What is the probability of earning a profit greater than $500,000? (4 points) (show your work in the template) oli (Dody) Paste B I U A11 XV fe Production Cost: Uniform A B 9 1 Selling Price $1,200 New Technology Cost(Fixed 2 cost) $850,000 3 Advertising Cost(Fixed cost) $700,000 4 5 6 Trained labor: Normal Distribution 7 Mean $75.00 8 Standard Deviation $35.00 9 10 11 Production Cost: Uniform Distribution 12 Smallest Value $185,00 13 Largest Value $455.00 14 15 16 Demand: Discrete Distribution 17 Demand Probability 18 1500 0.1 19 1600 0.1 20 2250 0.3 21 2400 0.3 22 2600 0.2 23 24 25 un D E F G H THA Trained Labor Nariable cost) Production Cost Nariable cost) Random Number First-Yex Demand Proft Function 1 2 3 4 5 6 7 8 9 10 11 12 13 14 15 16 17 18 19 20 21 22 23 24 25 26 27 28 29 30 31 32 33 34 35 36 37 38 39 40 * Summary of Statistics Mean Profit Standard Deviation of Profit Maximum Profit Minimum Profit Number of Losses Probability of Loss BONUS Number of Profit>500,000 Probability of Profit>500,000 Frequency Bin -1500000 -500000 0 Profit Ranges -500000 - - 1500000 - 1500000 --500000 -500000 - 0 0 - 1000000 1000000 - 1500000 1500000 - 2000000 2000000 - 2500000 2500000 - 3000000 3000000 - 4000000 >4000000 1000000 1500000 2000000 2500000 3000000 4000000

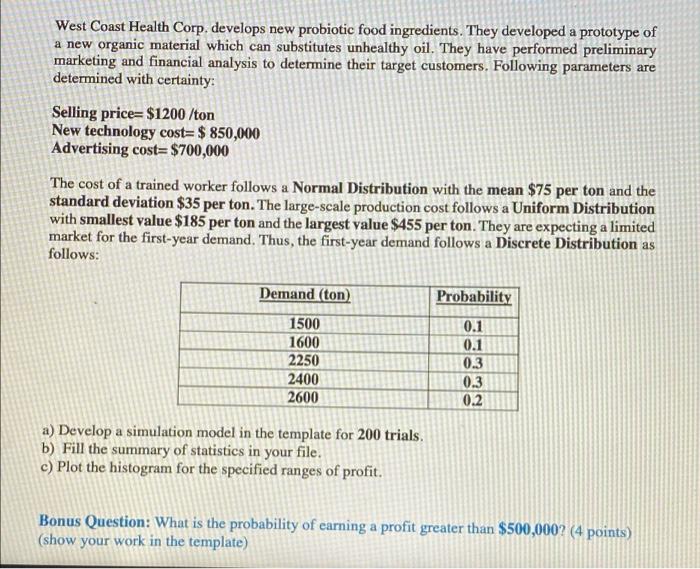
Step by Step Solution

There are 3 Steps involved in it

1 Expert Approved Answer
Step: 1 Unlock blur-text-image
Question Has Been Solved by an Expert!

Get step-by-step solutions from verified subject matter experts

Step: 2 Unlock
Step: 3 Unlock

Students Have Also Explored These Related General Management Questions!