

Question: Note: please specify where the p values are within the code. Will rate high QUESTIONS: 1. Was there an effect of antimicrobial agents? (was there
Note: please specify where the p values are within the code. Will rate high
QUESTIONS:
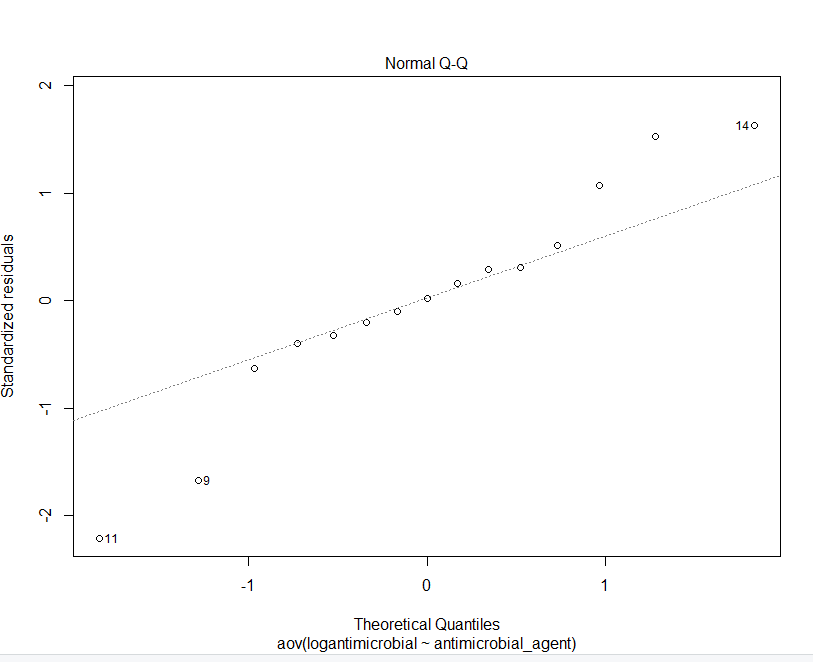
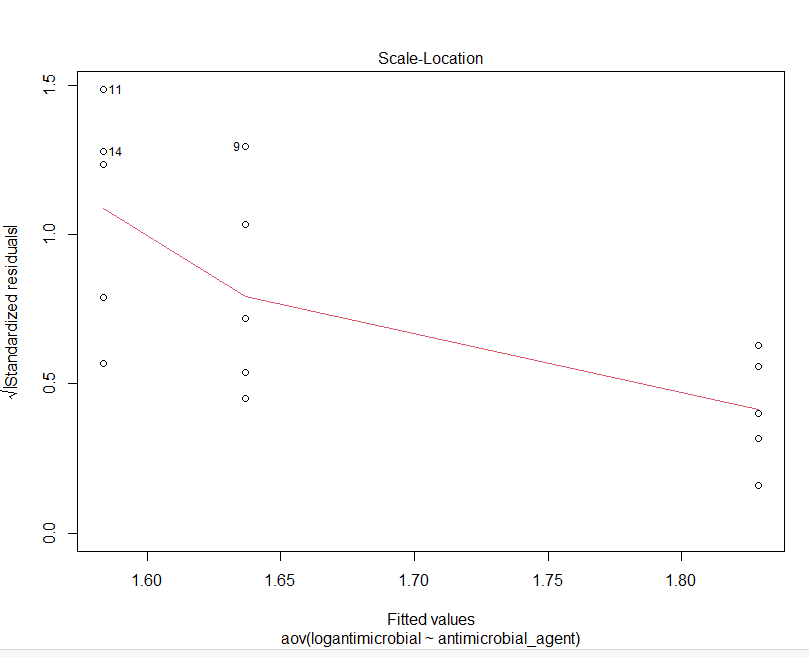
1. Was there an effect of antimicrobial agents? (was there any significant difference among the three treatment groups) (give p-value of overall model in support of your answer). 2. Which antimicrobial agent (if either) caused a significantly different protein synthesis rate relative to your control? (give p-values of pairwise comparisons to support your answer). 3. Consider your residuals, and the plots for residuals analysis. Do you detect any problems based on your analysis of residuals? If so, what problems do you detect? (provide your plots in support of your answer). 4. Look at your test of equality of variances (Levene's test). Does it indicate any violations of the assumptions for parametric tests? If so, what is indicated? 5. Based on your answers to questions 3 and 4, what might you need to do? 6. Please submit your statistical output and your residuals plots
TXT FILE THAT WAS USED:
antimicrobial_agent protein_synthesis control 5.25 control 5.13 control 4.86 control 5.53 control 5.38 new_agent 3.98 new_agent 4.56 new_agent 4.37 new_agent 2.98 new_agent 5.05 triclosan 2.48 triclosan 5.15 triclosan 3.43 triclosan 5.25 triclosan 3.64
R STUDIO RESULTS USING TXT FILE
> summary(antimicrobial) antimicrobial_agent protein_synthesis Length:15 Min. :2.480 Class :character 1st Qu.:3.810 Mode :character Median :4.860 Mean :4.469 3rd Qu.:5.200 Max. :5.530
> Tapply(protein_synthesis ~ antimicrobial_agent, var, na.action=na.omit, data=antimicrobial) control new_agent triclosan 0.06495 0.60427 1.41235
> # variances by group > leveneTest(protein_synthesis ~ antimicrobial_agent, data=antimicrobial, center="mean") Levene's Test for Homogeneity of Variance (center = "mean") Df F value Pr(>F) group 2 4.9069 0.02771 * 12 --- Signif. codes: 0 '***' 0.001 '**' 0.01 '*' 0.05 '.' 0.1 ' ' 1 > antimicrobial$logantimicrobial list(antimicrobial) [[1]] antimicrobial_agent protein_synthesis logantimicrobial 1 control 5.25 1.832581 2 control 5.13 1.813195 3 control 4.86 1.768150 4 control 5.53 1.876407 5 control 5.38 1.853168 6 new_agent 3.98 1.605430 7 new_agent 4.56 1.715598 8 new_agent 4.37 1.680828 9 new_agent 2.98 1.381282 10 new_agent 5.05 1.800058 11 triclosan 2.48 1.247032 12 triclosan 5.15 1.816452 13 triclosan 3.43 1.488400 14 triclosan 5.25 1.832581 15 triclosan 3.64 1.534714
> Tapply(logantimicrobial ~ antimicrobial_agent, var, na.action=na.omit, data=antimicrobial) control new_agent triclosan 0.001699117 0.025268589 0.060235582
> # variances by group > leveneTest(logantimicrobial ~ antimicrobial_agent, data=antimicrobial, center="mean") Levene's Test for Homogeneity of Variance (center = "mean") Df F value Pr(>F) group 2 4.2359 0.04057 * 12 --- Signif. codes: 0 '***' 0.001 '**' 0.01 '*' 0.05 '.' 0.1 ' ' 1
> model aovantimicrobial summary(aovantimicrobial) # prints a to the console Df Sum Sq Mean Sq F value Pr(>F) antimicrobial_agent 2 0.1661 0.08303 2.856 0.0967 . Residuals 12 0.3488 0.02907 --- Signif. codes: 0 '***' 0.001 '**' 0.01 '*' 0.05 '.' 0.1 ' ' 1 > TukeyHSD(aovantimicrobial) # means comparison Tukey multiple comparisons of means 95% family-wise confidence level
Fit: aov(formula = logantimicrobial ~ antimicrobial_agent, data = antimicrobial)
$antimicrobial_agent diff lwr upr p adj new_agent-control -0.19206097 -0.4797342 0.09561225 0.2171798 triclosan-control -0.24486421 -0.5325374 0.04280900 0.0991097 triclosan-new_agent -0.05280324 -0.3404765 0.23486998 0.8774821
GRAPHS OBTAINED FROM R STUDIO
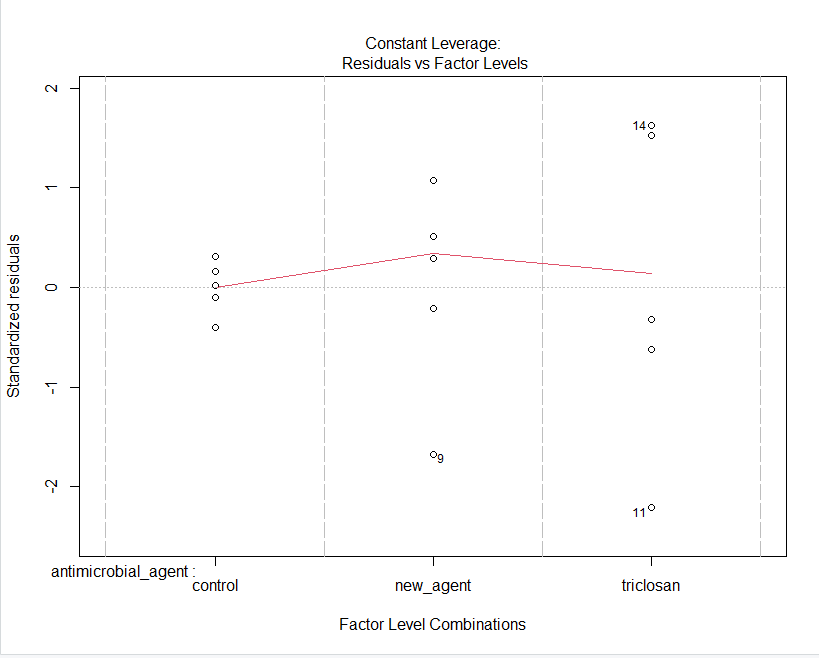
\fStandardized residuals -'i antimicrobial_agent : control Constant Leverage: Residuals vs Factor Levels nevv_agent Factor Level Combinations triclosan \f
Step by Step Solution
There are 3 Steps involved in it

Get step-by-step solutions from verified subject matter experts