

Question: Note: Round the answer to 2 decimal place is REQUIRED!! welry and you are the tales flow Analysis But Sheet Analysis Inc Stmt Prepare a
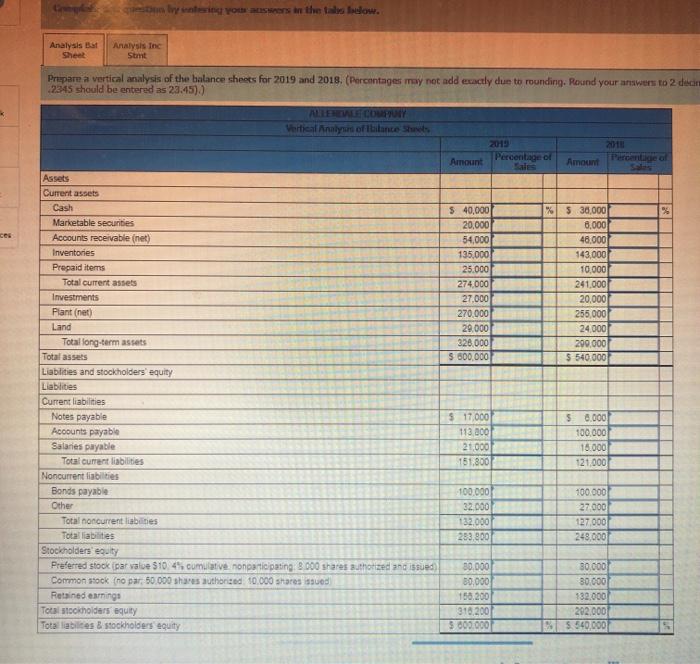
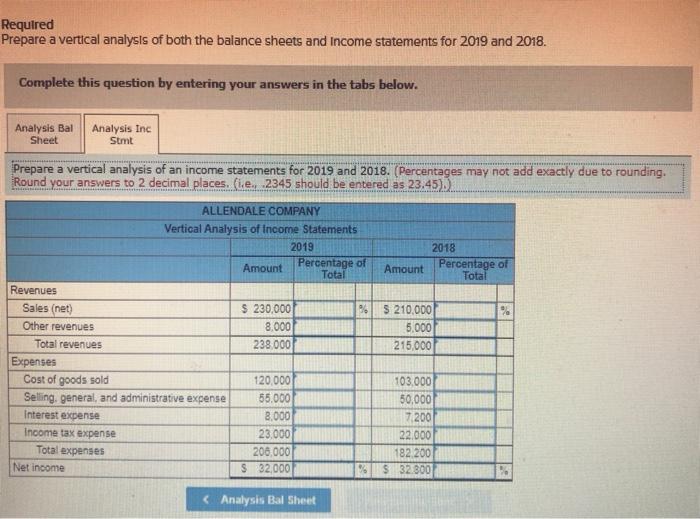
welry and you are the tales flow Analysis But Sheet Analysis Inc Stmt Prepare a vertical analysis of the balance sheets for 2019 and 2018. (Percentages may not add exactly due to rounding. Round your answers to 2 dicht 2345 should be entered as 23.45).) ALTERALE COY Vertical Analymond of balance Shwe 2019 Percentage of Amount 2011 Percentile of Amount % ces $ 40,000 20,000 54,000 135,000 25.000 274.000 27.000 270.000 29.000 326.000 $ 500.000 XS 30.000 6,000 46.000 143,000 10,000 241,000 20,000 255,000 24.000 299,000 $ 540.000 Assets Current assets Cash Marketable securities Accounts receivable (net) Inventories Prepaid items Total current assets Investments Plant (net) Land Total long-term assets Total assets Liabilities and stockholders equity Liabilities Current liabilities Notes payable Accounts payable Salaries payable Total current liabilities Noncurrent liabilities Bonds payable Other Total noncurrent liabities Total abilities Stockholders' equity Preferred stock (par value $10.45 cumulative nonparticipating 8000 shares Buthorized and issued) Common stock (no par: 50.000 shares authorized 10.000 shares issued Retained earnings Total stockholders equity Total abilities & stockholders equity $ 17,000 113.000 21.000 151,800 58.000 100.000 16.000 121.000 100.000 32.000 132.000 283.900 100.000 27.000 127.000 248.000 80.000 30,000 158.200 316,200 5 800.000 30.000 30.000 132.000 292.000 5 5 540,000 Required Prepare a vertical analysis of both the balance sheets and Income statements for 2019 and 2018. Complete this question by entering your answers in the tabs below. Analysis Bal Sheet Analysis Inc Stmt Prepare a vertical analysis of an income statements for 2019 and 2018. (Percentages may not add exactly due to rounding. Round your answers to 2 decimal places. e. 2345 should be entered as 23.45). ALLENDALE COMPANY Vertical Analysis of Income Statements 2019 Amount Percentage of Total 2018 Amount Percentage of Total 06 $ 230,000 8.000 238.000 $ 210,000 5.000 215.000 Revenues Sales (net) Other revenues Total revenues Expenses Cost of goods sold Selling, general, and administrative expense Interest expense Income tax expense Total expenses Net income 120,000 55,000 8,000 23.000 206,000 $ 32,000 103.000 50,000 7200 22.000 182.200 $32.300
Step by Step Solution
There are 3 Steps involved in it

Get step-by-step solutions from verified subject matter experts