

Question: NOTE: SHOW COMPUTATION/FORMULA IN MS EXCEL 1 3. The following table provides the crash data for the network project described in Problem 1. Activity Time
NOTE: SHOW COMPUTATION/FORMULA IN MS EXCEL
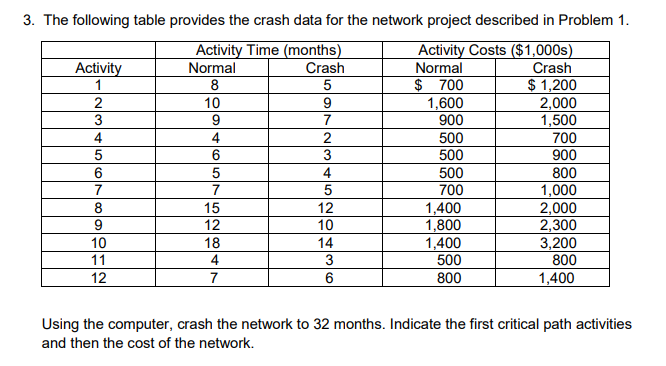
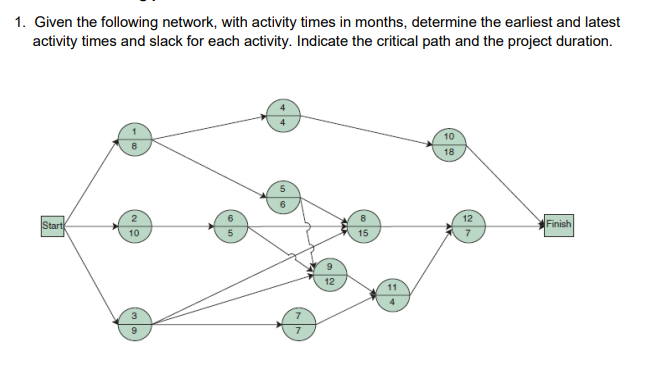
1 3. The following table provides the crash data for the network project described in Problem 1. Activity Time (months) Activity Costs ($1,000s) Activity Normal Crash Normal Crash 8 5 $ 700 $ 1,200 2 10 9 1,600 2,000 3 9 7 900 1,500 4 4 2 500 700 5 6 3 500 900 6 5 4 500 800 7 7 5 700 1,000 8 15 12 1,400 2,000 9 12 10 1,800 2,300 10 18 14 1,400 3,200 11 4 3 500 800 12 7 6 800 1,400 Using the computer, crash the network to 32 months. Indicate the first critical path activities and then the cost of the network. 1. Given the following network, with activity times in months, determine the earliest and latest activity times and slack for each activity. Indicate the critical path and the project duration. 8 10 18 6 8 12 Start 2 10 Finish 5 15 12 4 3 7 7 9
Step by Step Solution
There are 3 Steps involved in it
1 Expert Approved Answer
Step: 1 Unlock

Question Has Been Solved by an Expert!
Get step-by-step solutions from verified subject matter experts
Step: 2 Unlock
Step: 3 Unlock