

Question: Problem 6- Please use EXCEL SOLVER ONLY using the STARTUP FILE given. Show all the steps and formulas B H K M Crash Information Crash
Problem 6-
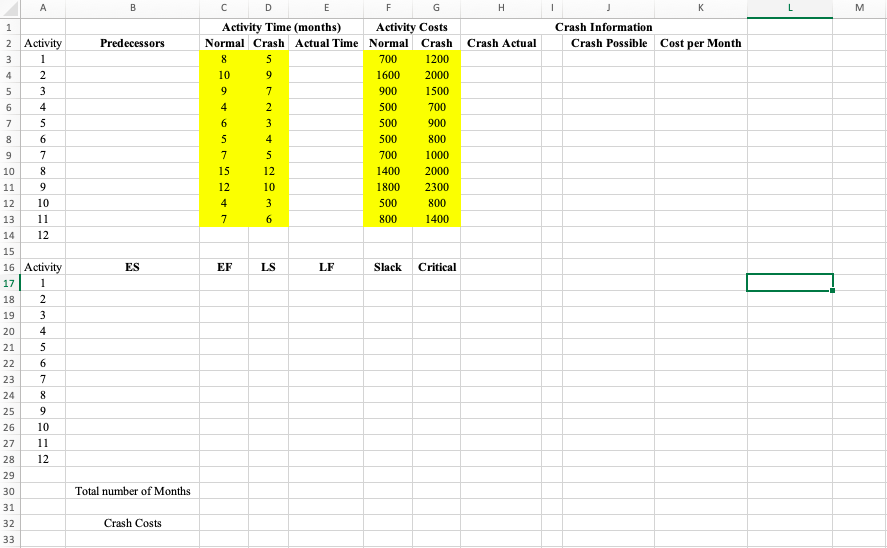
Please use EXCEL SOLVER ONLY using the STARTUP FILE given. Show all the steps and formulas
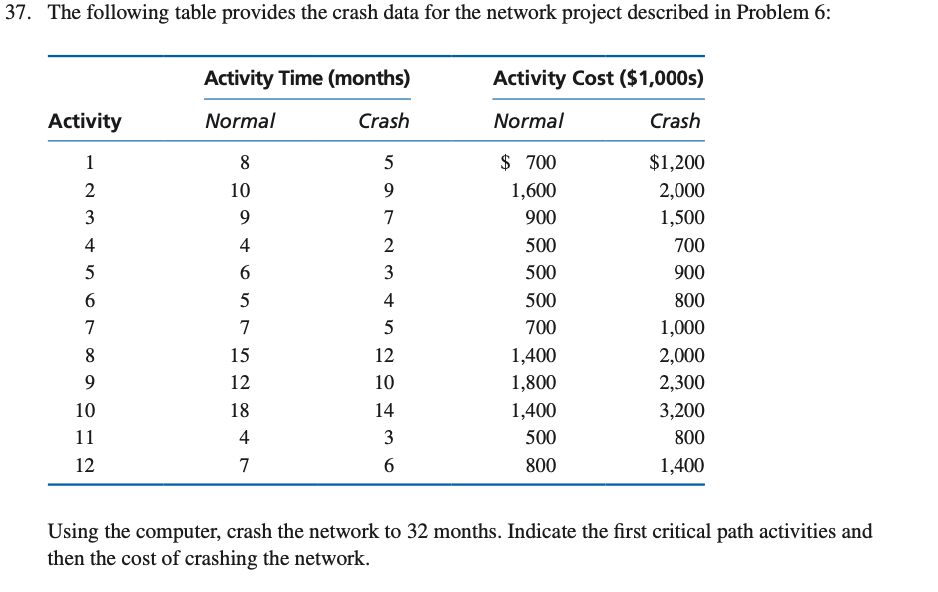
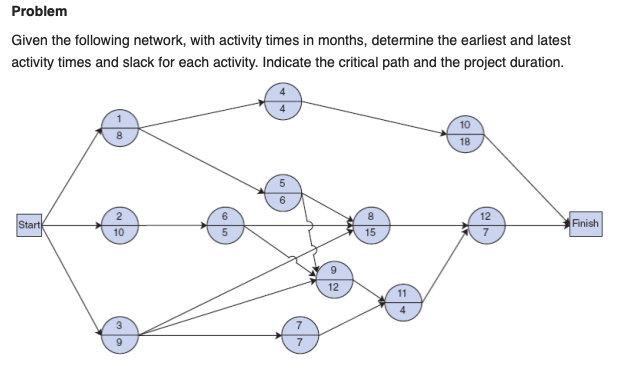
B H K M Crash Information Crash Possible Predecessors Cost per Month 1 2 Activity 3 1 4. 2 5 3 6 4 7 5 8 6 9 7 10 8 11 9 12 10 13 11 14 12 15 16 Activity 17 1 18 2 19 3 20 4 21 5 D E F G Activity Time (months) Activity Costs Normal Crash Actual Time Normal Crash Crash Actual 8 5 700 1200 10 9 1600 2000 9 7 900 1500 4 2 500 700 6 3 500 900 S 4 500 800 7 5 700 1000 15 12 1400 2000 12 10 1800 2300 4 3 500 800 7 6 800 1400 ES EF LS LF Slack Critical 22 6 7 23 24 25 8 26 9 10 11 12 27 28 Total number of Months 29 30 31 32 Crash Costs 33 37. The following table provides the crash data for the network project described in Problem 6: Activity Time (months) Activity Cost ($1,000s) Activity Normal Crash Normal Crash 1 2 3 8 10 9 5 9 7 4 5 6 4 6 2 3 $ 700 1,600 900 500 500 500 700 1,400 1,800 1,400 500 800 5 7 15 12 18 4 7 7 $1,200 2,000 1,500 700 900 800 1,000 2,000 2,300 3,200 800 1,400 4 5 12 10 14 8 9 10 11 12 3 6 Using the computer, crash the network to 32 months. Indicate the first critical path activities and then the cost of crashing the network. Problem Given the following network, with activity times in months, determine the earliest and latest activity times and slack for each activity. Indicate the critical path and the project duration. 8 10 18 5 6 Start 2 10 12 7 Finish 5 15 12 11 4 3 7 B H K M Crash Information Crash Possible Predecessors Cost per Month 1 2 Activity 3 1 4. 2 5 3 6 4 7 5 8 6 9 7 10 8 11 9 12 10 13 11 14 12 15 16 Activity 17 1 18 2 19 3 20 4 21 5 D E F G Activity Time (months) Activity Costs Normal Crash Actual Time Normal Crash Crash Actual 8 5 700 1200 10 9 1600 2000 9 7 900 1500 4 2 500 700 6 3 500 900 S 4 500 800 7 5 700 1000 15 12 1400 2000 12 10 1800 2300 4 3 500 800 7 6 800 1400 ES EF LS LF Slack Critical 22 6 7 23 24 25 8 26 9 10 11 12 27 28 Total number of Months 29 30 31 32 Crash Costs 33 37. The following table provides the crash data for the network project described in Problem 6: Activity Time (months) Activity Cost ($1,000s) Activity Normal Crash Normal Crash 1 2 3 8 10 9 5 9 7 4 5 6 4 6 2 3 $ 700 1,600 900 500 500 500 700 1,400 1,800 1,400 500 800 5 7 15 12 18 4 7 7 $1,200 2,000 1,500 700 900 800 1,000 2,000 2,300 3,200 800 1,400 4 5 12 10 14 8 9 10 11 12 3 6 Using the computer, crash the network to 32 months. Indicate the first critical path activities and then the cost of crashing the network. Problem Given the following network, with activity times in months, determine the earliest and latest activity times and slack for each activity. Indicate the critical path and the project duration. 8 10 18 5 6 Start 2 10 12 7 Finish 5 15 12 11 4 3 7
Step by Step Solution
There are 3 Steps involved in it

Get step-by-step solutions from verified subject matter experts