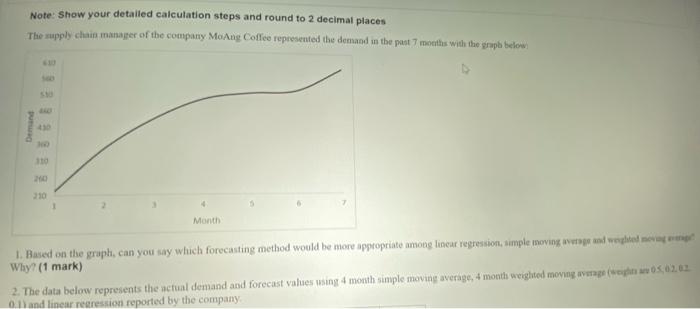
Question: Note: Show your detailed calculation steps and round to 2 decimal places The supply chain manager of the company MoAng Coffee represented the demand in

Note: Show your detailed calculation steps and
Note: Show your detailed calculation steps and round to 2 decimal places The supply chain manager of the company MoAng Coffee represented the demand in the past 7 months with the graph below Demand 110 210 Month 1. Based on the graph, can you say which forecasting method would be more appropriate among linear regression, simple moving stage and weighted Why? (1 mark) 2. The data below represents the actual demand and forecast values in mouth simple moving average, 4 month weighted moving smp (02.02 01 and linear regression reported by the company Abs. Dev LR Abs. Dev Month 1 2 3 4 5 6 7 Demand SMA Abs. Dev WMA 222 350 440 500 520 378 142 430.20 530 452.50 77.50 483 600 89.80 47 507.93 564.14 12.07 34.14 The output of linear regression using Excel is as follows: SUMMARY OUTPUT Regression Statistics Multiple R 0.948438 R Square 0.899534 Adjusted R 0.879441 Standard E 44.45704 Observatio 7 ANOVA df SS MS F ignificance F Regression 1 88481.28571 88481.29 44.76827 0.001128 Residual S 9882.142857 1976.429 Total 6 98363.42857 EN English (United States) Coefficients Stand SUMMARY Regression Statistics Multiple R 0.948438 R Square 0.899534 Adjusted R 0.879441 Standard E 44.45704 Observatio 7 ANOVA df Regression Residual Total SS MS F ignificance F 1 88481.28571 88481.29 44.76827 0.001128 5 9882.142857 1976.429 6 98363.42857 Coefficients Standard Error Stot P-value Lower 95% Upper 95%ower 95.0Mpper 95.0% Intercept 226.8571 37.57305809 6.037761 0.001795 130.2725 323.4418 130.2725 323.4418 X Variable 56.21429 8.4015912 6.690909 0.001128 34.61731 77.81126 34.61731 77.81126 a. According to the LR output do you thinli According to the LR output, do you think linear regression is appropriate in this case? Why? (1 mark) Complete calculations of forecasts and absolute deviations for the three forecasting methods in month 7. (4 marks) c. Calculate MAD for 4 month simple moving average. 4 month weighted moving average and linear regression. Which method is better? Why? (2 marks) For the toolbar, press ALT F10 (PC) or ALTEN.E10 (Mac)

Step by Step Solution

There are 3 Steps involved in it

1 Expert Approved Answer
Step: 1 Unlock blur-text-image
Question Has Been Solved by an Expert!

Get step-by-step solutions from verified subject matter experts

Step: 2 Unlock
Step: 3 Unlock

Students Have Also Explored These Related General Management Questions!