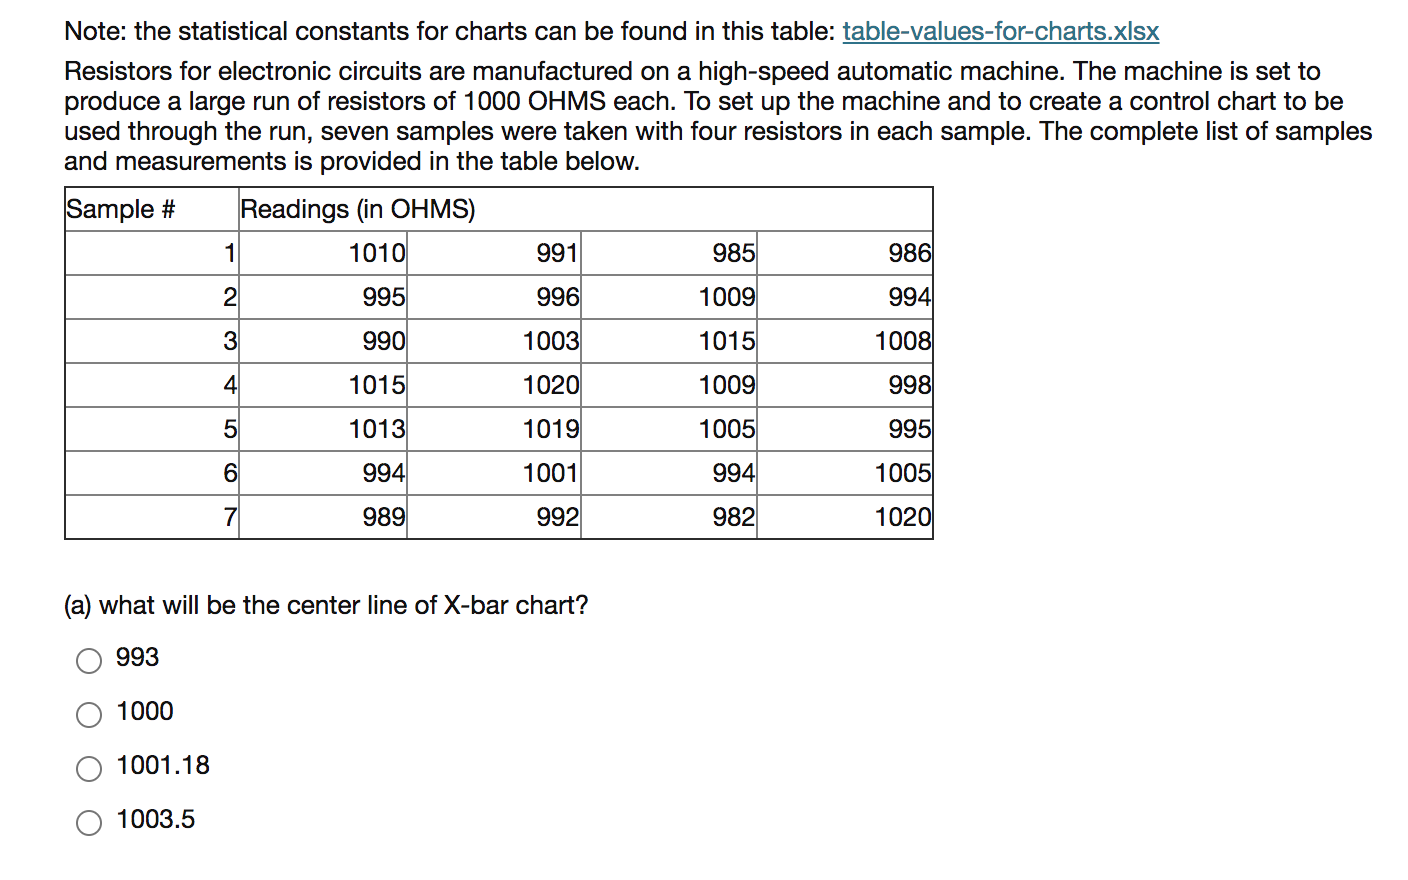
Question: Note: the statistical constants for charts can be found in this table: table-values-for-charts.xlsx Resistors for electronic circuits are manufactured on a high-speed automatic machine. The

Note: the statistical constants for charts can beNote: the statistical constants for charts can beNote: the statistical constants for charts can be

Note: the statistical constants for charts can be found in this table: table-values-for-charts.xlsx Resistors for electronic circuits are manufactured on a high-speed automatic machine. The machine is set to produce a large run of resistors of 1000 OHMS each. To set up the machine and to create a control chart to be used through the run, seven samples were taken with four resistors in each sample. The complete list of samples and measurements is provided in the table below. Sample # Readings in OHMS) 1 1010 991 985 9861 2 995 996 1009 994 3 990 1003 1015 1008 4 1015 1020 1009 998 5 1013 1019 1005 995 6 994 1001 994 1005 7 989 992 982 1020 (a) what will be the center line of X-bar chart? 993 1000 1001.18 1003.5 (b) Refer to the data in the resistors question. What will be the center line of R-chart? (that is, what is R-bar value?) 22.86 27 30.5 O 38 (c) refer to the data in the resistors question. What is the value of the lower control limit in the X-bar chart? 932.61 984.52 985.26 991.60

Step by Step Solution

There are 3 Steps involved in it

1 Expert Approved Answer
Step: 1 Unlock blur-text-image
Question Has Been Solved by an Expert!

Get step-by-step solutions from verified subject matter experts

Step: 2 Unlock
Step: 3 Unlock

Students Have Also Explored These Related General Management Questions!