

Question: please thoroughly read it and then answer here are some clearer photos Resistors for electronic circuits are manufactured on a high-speed autornated machine. The machine
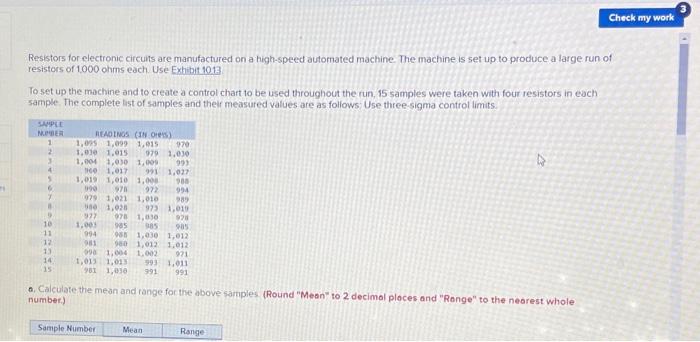
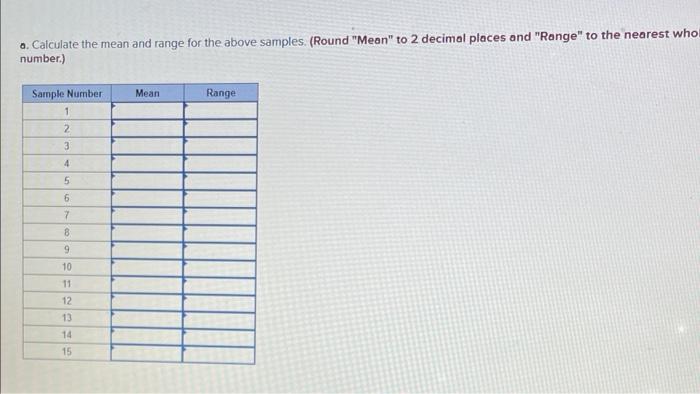
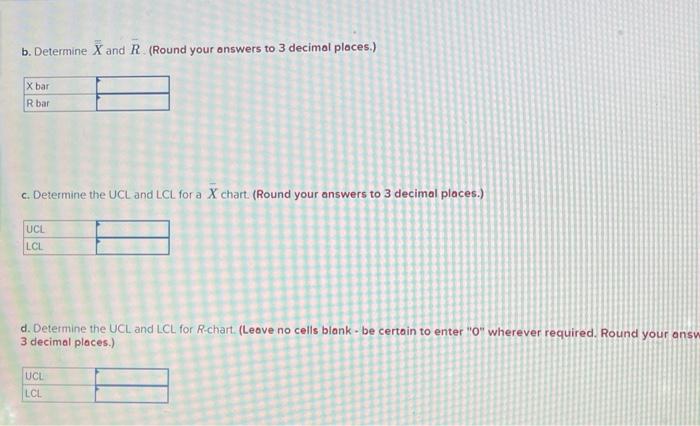
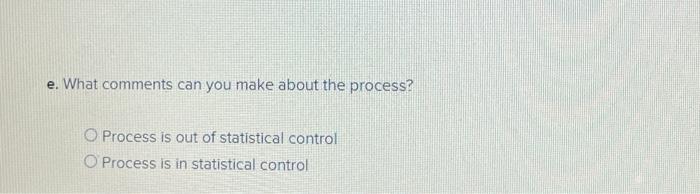
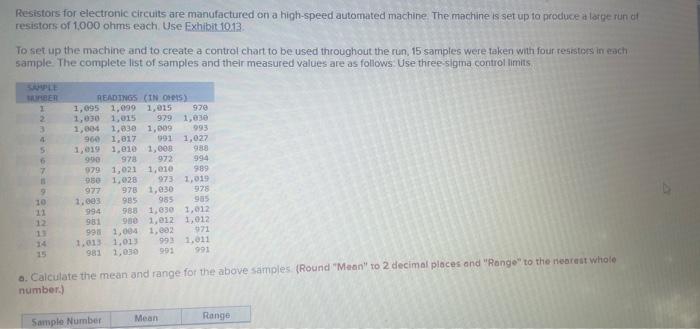
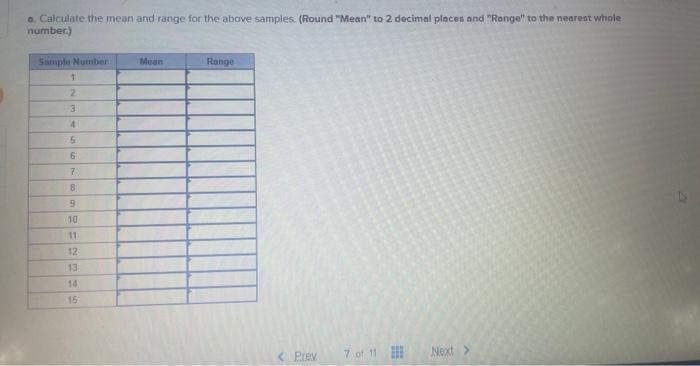
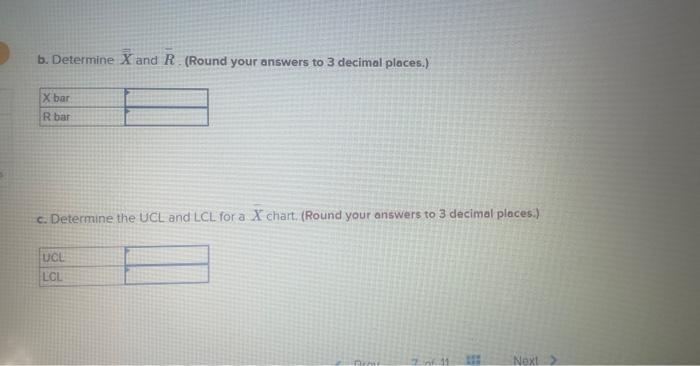
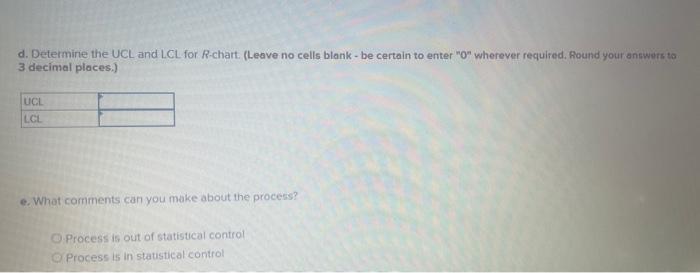
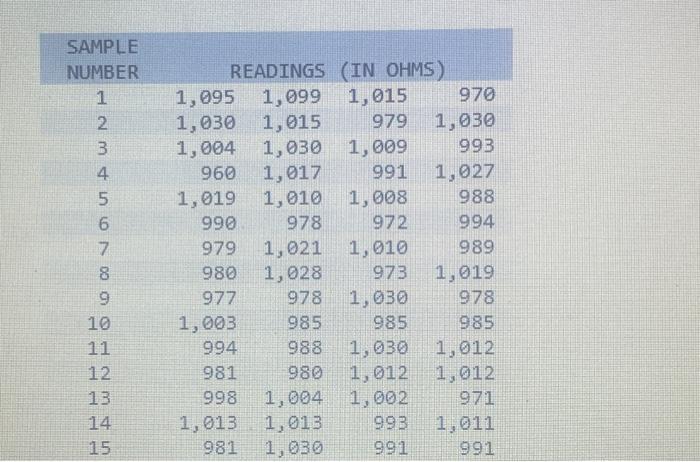
Resistors for electronic circuits are manufactured on a high-speed autornated machine. The machine is set up to produce a large run of resistors of 1000 ohms each Use Exhibit 1013 To set up the machine and to create a control chart to be used throughout the run, 15 samples were taken with four resistors in each sample. The complete list of samples and their measured values are as follows: Use three sigma control limits. a. Calculate the mean and range for the above sarmples (Round "Mean" to 2 decimol ploces and "Ronge" to the neorest whole number.) a. Calculate the mean and range for the above samples. (Round "Mean" to 2 decimal places and "Range" to the nearest wh number.) b. Determine X and R (Round your onswers to 3 decimal places.) c. Determine the UCL and LCL for a X chart. (Round your answers to 3 decimal places.) d. Determine the UCL, and LCL for R-chart. (Leove no cells blank - be certoin to enter "O" wherever required. Round your ons 3 decimal places.) e. What comments can you make about the process? Process is out of statistical control Process is in statistical control Resistors for electronic circuits are manufactured on a high-speed automated machine. The machine is set up to produce at lotpe run af resistors of 1,000 ohms each. Use Exhibit 1013. To set up the machine and to create a control chart to be used throughout the run, 15 samples were taken with four resistors in each sample The complete list of samples and their measured values are as follows Use three-sigina control limits o. Calculate the mean and range for the above samples (Round "Mean" to 2 decimal places and "Range" to the nearat whole number.) a. Calculate the mean and range for the above samples. (Round "Mean" to 2 decimal pleces and "Ronge" to the neareat whole. number.) b. Determine X and R. (Round your answers to 3 decimal places.) c. Determine the UCL and LCL for a X chart. (Round your answers to 3 decimal places.) d. Determine the UCL and LCL for R-chart. (Leave no cells blank - be certain to enter "on wherever required, found your answers to 3 decmal places.) e. What comments can you make about the process? Process is out of statistical control Process is in statistical control \begin{tabular}{|crrrr} SAMPLE & \multicolumn{5}{c}{ REAINGS } & (IN OHMS) \\ NUMBER & \multicolumn{5}{c}{ REA } \\ \hline 1 & 1,095 & 1,099 & 1,015 & 970 \\ 2 & 1,030 & 1,015 & 979 & 1,030 \\ 3 & 1,004 & 1,030 & 1,009 & 993 \\ 4 & 960 & 1,017 & 991 & 1,027 \\ 5 & 1,019 & 1,010 & 1,008 & 988 \\ 6 & 990 & 978 & 972 & 994 \\ 7 & 979 & 1,021 & 1,010 & 989 \\ 8 & 980 & 1,028 & 973 & 1,019 \\ 9 & 977 & 978 & 1,030 & 978 \\ 10 & 1,003 & 985 & 985 & 985 \\ 11 & 994 & 988 & 1,030 & 1,012 \\ 12 & 981 & 980 & 1,012 & 1,012 \\ 13 & 998 & 1,004 & 1,002 & 971 \\ 14 & 1,013 & 1,013 & 993 & 1,011 \\ 15 & 981 & 1,030 & 991 & 991 \\ \hline \end{tabular}
Step by Step Solution
There are 3 Steps involved in it

Get step-by-step solutions from verified subject matter experts