

Question: nOTE : y1=sin(x/2), y2= sin(x) and y3= sin(2x) x is define to be the colomn vector ranging from 0 to 2.pi with 25 entries .
nOTE : y1=sin(x/2), y2= sin(x) and y3= sin(2x)
x is define to be the colomn vector ranging from 0 to 2.pi with 25 entries .
Please follow the steps and use Matlab .
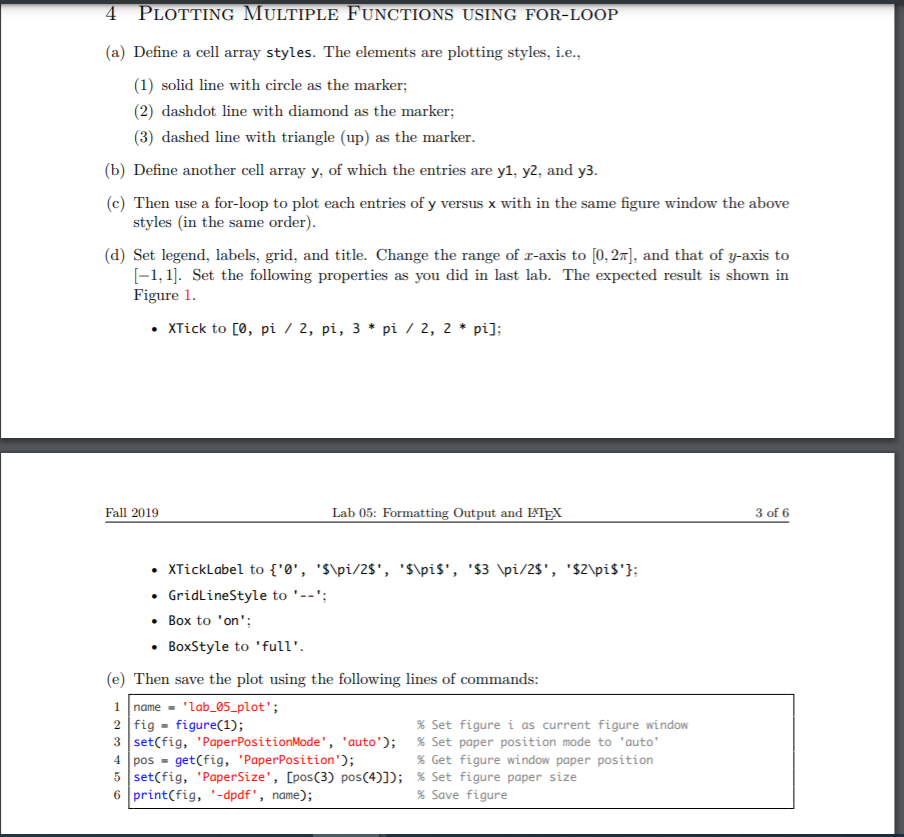
4 PLOTTING MULTIPLE FUNCTIONS USING FOR-LOOP (a) Define a cell array styles. The elements are plotting styles, i.e., (1) solid line with circle as the marker; (2) dashdot line with diamond as the marker; (3) dashed line with triangle (up) as the marker. (b) Define another cell array y, of which the entries are y1, y2, and y3. (c) Then use a for-loop to plot each entries of y versus x with in the same figure window the above styles in the same order). (d) Set legend, labels, grid, and title. Change the range of r-axis to [0,28], and that of y-axis to [-1,1]. Set the following properties as you did in last lab. The expected result is shown in Figure 1. XTick to [0, pi / 2, pi, 3 * pi / 2, 2 * pi]; Fall 2019 Lab 05: Formatting Output and LATEX 3 of 6 XTickLabel to {'0', 'S\pi/2$', 'S\pis', '$3 \pi/28', '$2\pi$'}; GridLineStyle to '--'; Box to 'on'; BoxStyle to 'full'. (e) Then save the plot using the following lines of commands: 1 name = 'lab_05_plot'; 2 fig - figure(1); % Set figure i as current figure window 3 set(fig, 'Paper PositionMode', 'auto'); % Set paper position mode to 'auto' 4 pos = get(fig, 'Paper Position'); % Get figure window paper position 5 set(fig, 'PaperSize', [pos(3) pos(4)]); % Set figure paper size 6 print(fig, '-dpdf', name); % Save figure
Step by Step Solution
There are 3 Steps involved in it

Get step-by-step solutions from verified subject matter experts