

Question: now image are clear Here is the data 20 Supply Chain Round Dashboard Your score 4. Best score 40 DOSE Review Key Performance Metrics and
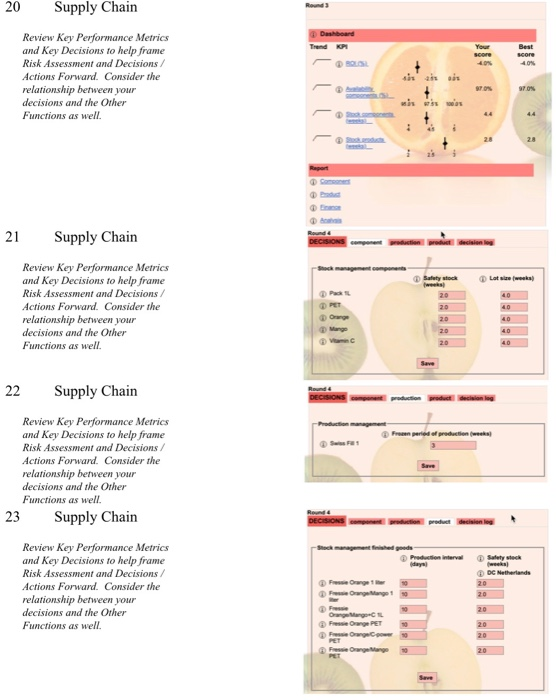
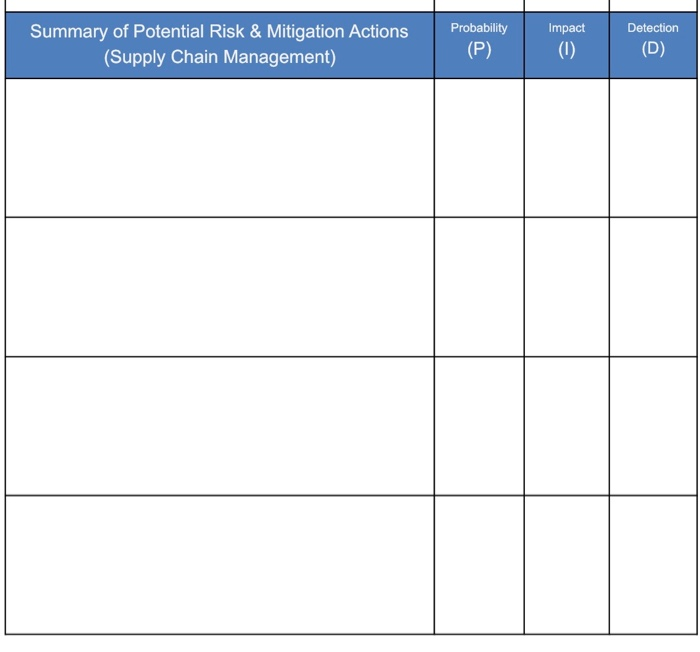
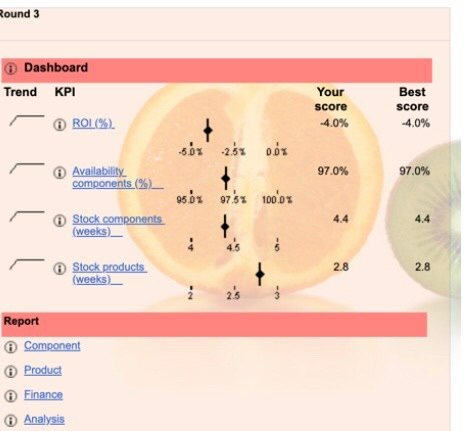
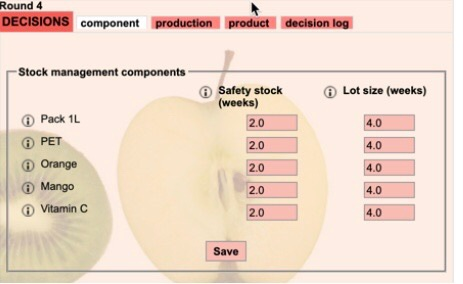
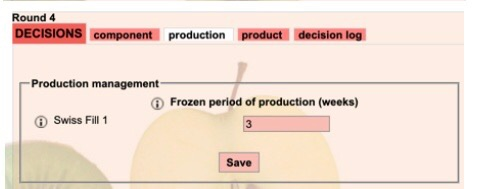
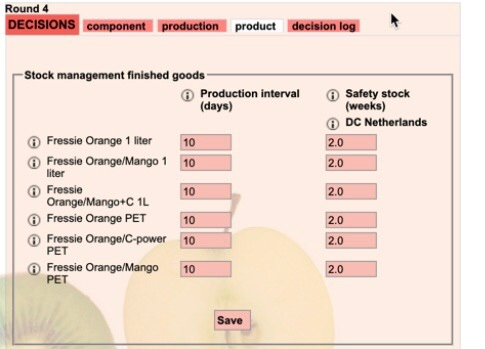
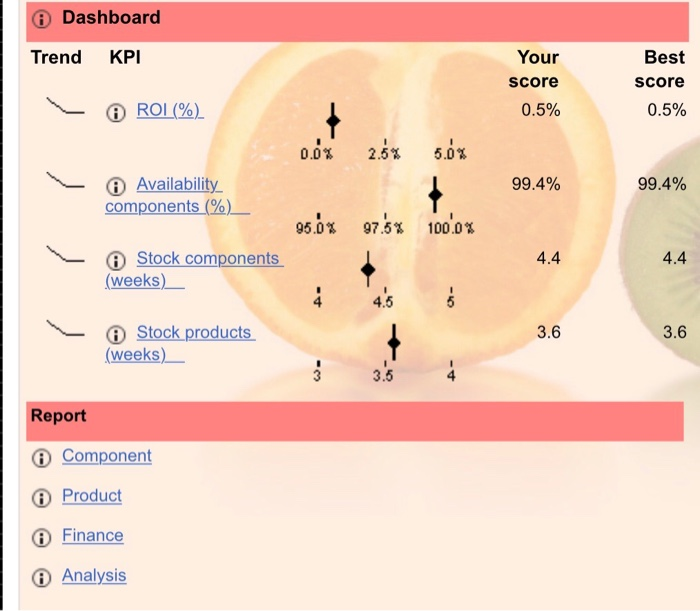
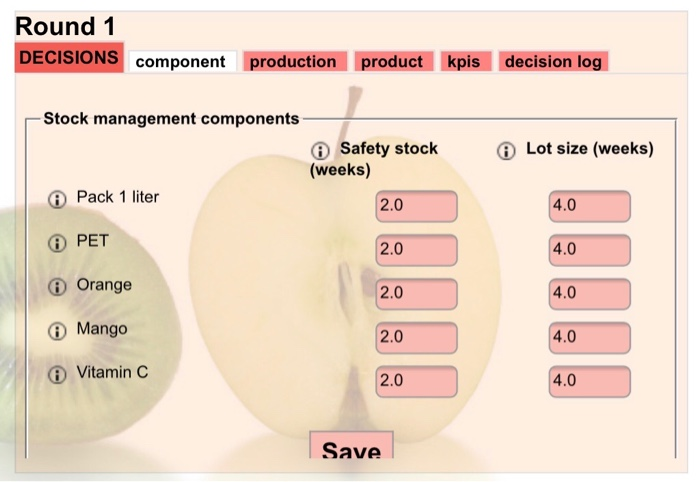
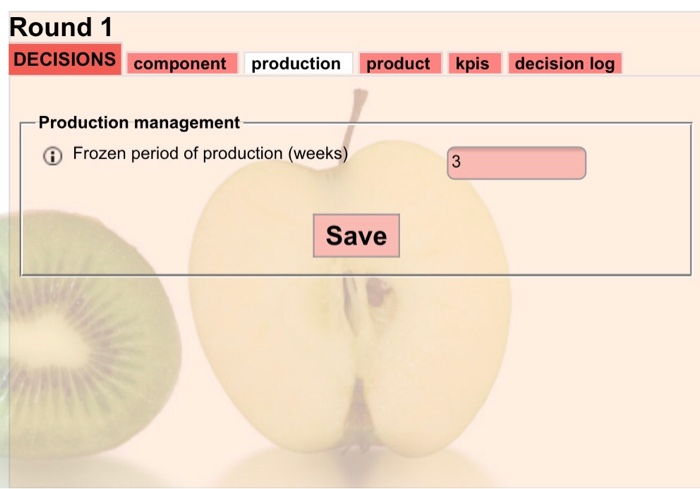
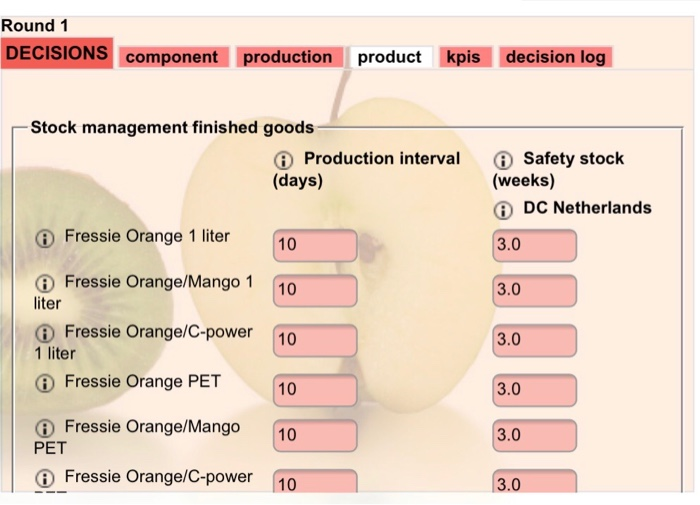
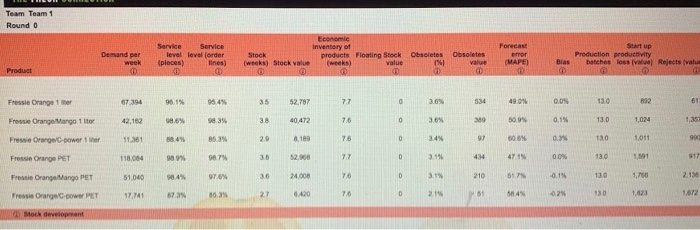
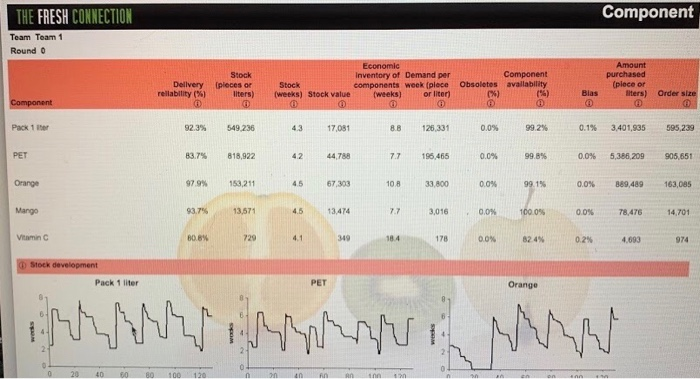
20 Supply Chain Round Dashboard Your score 4. Best score 40 DOSE Review Key Performance Metrics and Key Decisions to help frame Risk Assessment and Decisions Actions Forward. Consider the relationship between your decisions and the Other Functions as well 44 3 28 28 decisiones Stock management components 21 Supply Chain Review Key Performance Metrics and Key Decisions to help frame Risk Assessment and Decisions / Actions Forward. Consider the relationship between your decisions and the Other Functions as well. Safety 20 20 20 20 40 Mange 40 40 Save 22 Supply Chain DECISIONS From period of Auction Review Key Performance Metrics and Key Decisions to help frame Risk Assessment and Decisions / Actions Forward. Consider the relationship between your decisions and the Other Functions as well. 23 Supply Chain Review Key Performance Metrics and Key Decisions to help frame Risk Assessment and Decisions / Actions Forward. Consider the relationship between your decisions and the Other Functions as well Production interval Safety stock DC Netherlands 20 Frangongo 19 20 20 Orange Mango Free PET 10 Org. 19 Free Organge PET 20 20 20 Detection Summary of Potential Risk & Mitigation Actions (Supply Chain Management) Probability (P) Impact (1) (D) Round 3 Dashboard Trend KPI Your score -4.0% Best score -4.0% ROI(%). -6.02.2.53 0.0% 97.0% Availability components.(%) 97.0% 95.0% 07.5% 100.0% 1 ) ) 4.4 4.4 Stock components (weeks) 4.5 Stock products (weeks) 2.8 2.8 2 2.5 Report Component Product Finance Analysis Round 4 DECISIONS component production product decision log -Stock management components Lot size (weeks) Safety stock (weeks) 2.0 2.0 4.0 4.0 Pack 1L PET Orange Mango Vitamin C 2.0 4.0 2.0 4.0 2.0 4.0 Save Round 4 DECISIONS component production product decision log - Production management Frozen period of production (weeks) Swiss Fill 1 Save Round 4 DECISIONS component production product decision log Safety stock (weeks) DC Netherlands 2.0 2.0 - Stock management finished goods Production interval (days) Fressie Orange 1 liter 10 Fressie Orange/Mango 1 10 liter Fressie 10 Orange/Mango+C 1L Fressie Orange PET 10 Fressie Orange/C-power 10 PET Fressie Orange/Mango PET 2.0 2.0 2.0 10 2.0 Save Dashboard Trend KPI Your score 0.5% Best score 0.5% ROI (%) 0.0% 2.6% 5.0% 99.4% 99.4% Availability components (%) 95.0% 97.5% 100.0% 4.4 4.4 Stock components (weeks) 4 -- 4.5 3.6 3.6 Stock products (weeks) W- Report Component 0 Product Finance Analysis Round 1 DECISIONS component production product kpis decision log -Stock management components Safety stock (weeks) Pack 1 liter 2.0 Lot size (weeks) 4.0 0 2.0 4.0 0 Orange 2.0 4.0 Mango 2.0 4.0 Vitamin C 2.0 4.0 Save Round 1 DECISIONS component production product kpis decision log -Production management Frozen period of production (weeks) 3 Save Round 1 DECISIONS component production product kpis decision log -Stock management finished goods 0 Production interval (days) Safety stock (weeks) DC Netherlands Fressie Orange 1 liter 10 3.0 10 3.0 Fressie Orange/Mango 1 liter Fressie Orange/C-power 1 liter Fressie Orange PET 10 3.0 10 3.0 10 3.0 Fressie Orange/Mango PET Fressie Orange/C-power 10 3.0 Summary of Potential Risk & Mitigation Actions (Supply Chain Management) Probability (P) Impact (0) Detection (D) Team Team 1 Round o Demand per week D Service Service level level order (places) lines) Economic Inventory of Stock products Floating Stock [weeks) Stock value value D D Obsoletes IN Obsoletes value Forecast error (MAPE) Startup Production productivity batches loss (value) Rejects (value Bias Product Fressie Orange 1 07394 96.1% 95.4% 35 52.787 7.7 0 3.6% 534 490N 0.0% 13.0 892 61 Frossle Orange Vango 1 ter 42,162 98.6% se 8% 38 40,472 7,6 0 3.6% 389 50.95 0.1% 13.0 1,024 1,357 Fressie Orange C-power 1 11.361 8849 853% 29 8.189 7.6 0 3.4% 97 60.6% 0.3% 130 1,011 118.084 Fress Orange PET 989% 98.7% 38 52.98 7.7 D 3.14 434 4715 0.0% 1.501 917 51.040 98.4% 97.6% 36 24,008 76 0 3.1 210 5. -0.1% 13.0 1.760 2.134 Fressie Orange Vango PET Fressie Orange C-power PET 17,741 67.3 16.3 27 6.420 O 2.14 . 51 584% 0.29 13.0 1.823 1,672 Stock development THE FRESH CONNECTION Component Team Team 1 Round 0 Stock Delivery (pleces or reliability (%) liters) 0 Economic Inventory of Demand per Stock components week (plece [weeks) Stock value [weeks) or liter) 0 Component Obsoletes availability C%) (6) Amount purchased (plece or liters) Order size Bias Component Pack 1 or 92.3% 549,236 43 17,081 126,331 0.0% 99.2% 0.1% 3,401,935 595,239 PET 83.7% 818,922 42 44.788 77 196,465 0.0% 99.8% 0.0% 5,386,209 905,651 Orange 97.9% 153,211 4.5 67,303 108 33.800 0.0% 99.1% 0.0% 389,489 163,085 Mango 93.7 13,571 4.5 13,474 7.7 3,016 0.0% 100.0% 0.0% 78.476 14,701 Vitamin 80.8% 729 349 18.4 178 0.0% 8249 0.2% 4.693 974 Stock development Pack 1 liter PET Orange | Mwan MW 20 40 60 80 100 120 on an in son 12 en 20 Supply Chain Round Dashboard Your score 4. Best score 40 DOSE Review Key Performance Metrics and Key Decisions to help frame Risk Assessment and Decisions Actions Forward. Consider the relationship between your decisions and the Other Functions as well 44 3 28 28 decisiones Stock management components 21 Supply Chain Review Key Performance Metrics and Key Decisions to help frame Risk Assessment and Decisions / Actions Forward. Consider the relationship between your decisions and the Other Functions as well. Safety 20 20 20 20 40 Mange 40 40 Save 22 Supply Chain DECISIONS From period of Auction Review Key Performance Metrics and Key Decisions to help frame Risk Assessment and Decisions / Actions Forward. Consider the relationship between your decisions and the Other Functions as well. 23 Supply Chain Review Key Performance Metrics and Key Decisions to help frame Risk Assessment and Decisions / Actions Forward. Consider the relationship between your decisions and the Other Functions as well Production interval Safety stock DC Netherlands 20 Frangongo 19 20 20 Orange Mango Free PET 10 Org. 19 Free Organge PET 20 20 20 Detection Summary of Potential Risk & Mitigation Actions (Supply Chain Management) Probability (P) Impact (1) (D) Round 3 Dashboard Trend KPI Your score -4.0% Best score -4.0% ROI(%). -6.02.2.53 0.0% 97.0% Availability components.(%) 97.0% 95.0% 07.5% 100.0% 1 ) ) 4.4 4.4 Stock components (weeks) 4.5 Stock products (weeks) 2.8 2.8 2 2.5 Report Component Product Finance Analysis Round 4 DECISIONS component production product decision log -Stock management components Lot size (weeks) Safety stock (weeks) 2.0 2.0 4.0 4.0 Pack 1L PET Orange Mango Vitamin C 2.0 4.0 2.0 4.0 2.0 4.0 Save Round 4 DECISIONS component production product decision log - Production management Frozen period of production (weeks) Swiss Fill 1 Save Round 4 DECISIONS component production product decision log Safety stock (weeks) DC Netherlands 2.0 2.0 - Stock management finished goods Production interval (days) Fressie Orange 1 liter 10 Fressie Orange/Mango 1 10 liter Fressie 10 Orange/Mango+C 1L Fressie Orange PET 10 Fressie Orange/C-power 10 PET Fressie Orange/Mango PET 2.0 2.0 2.0 10 2.0 Save Dashboard Trend KPI Your score 0.5% Best score 0.5% ROI (%) 0.0% 2.6% 5.0% 99.4% 99.4% Availability components (%) 95.0% 97.5% 100.0% 4.4 4.4 Stock components (weeks) 4 -- 4.5 3.6 3.6 Stock products (weeks) W- Report Component 0 Product Finance Analysis Round 1 DECISIONS component production product kpis decision log -Stock management components Safety stock (weeks) Pack 1 liter 2.0 Lot size (weeks) 4.0 0 2.0 4.0 0 Orange 2.0 4.0 Mango 2.0 4.0 Vitamin C 2.0 4.0 Save Round 1 DECISIONS component production product kpis decision log -Production management Frozen period of production (weeks) 3 Save Round 1 DECISIONS component production product kpis decision log -Stock management finished goods 0 Production interval (days) Safety stock (weeks) DC Netherlands Fressie Orange 1 liter 10 3.0 10 3.0 Fressie Orange/Mango 1 liter Fressie Orange/C-power 1 liter Fressie Orange PET 10 3.0 10 3.0 10 3.0 Fressie Orange/Mango PET Fressie Orange/C-power 10 3.0 Summary of Potential Risk & Mitigation Actions (Supply Chain Management) Probability (P) Impact (0) Detection (D) Team Team 1 Round o Demand per week D Service Service level level order (places) lines) Economic Inventory of Stock products Floating Stock [weeks) Stock value value D D Obsoletes IN Obsoletes value Forecast error (MAPE) Startup Production productivity batches loss (value) Rejects (value Bias Product Fressie Orange 1 07394 96.1% 95.4% 35 52.787 7.7 0 3.6% 534 490N 0.0% 13.0 892 61 Frossle Orange Vango 1 ter 42,162 98.6% se 8% 38 40,472 7,6 0 3.6% 389 50.95 0.1% 13.0 1,024 1,357 Fressie Orange C-power 1 11.361 8849 853% 29 8.189 7.6 0 3.4% 97 60.6% 0.3% 130 1,011 118.084 Fress Orange PET 989% 98.7% 38 52.98 7.7 D 3.14 434 4715 0.0% 1.501 917 51.040 98.4% 97.6% 36 24,008 76 0 3.1 210 5. -0.1% 13.0 1.760 2.134 Fressie Orange Vango PET Fressie Orange C-power PET 17,741 67.3 16.3 27 6.420 O 2.14 . 51 584% 0.29 13.0 1.823 1,672 Stock development THE FRESH CONNECTION Component Team Team 1 Round 0 Stock Delivery (pleces or reliability (%) liters) 0 Economic Inventory of Demand per Stock components week (plece [weeks) Stock value [weeks) or liter) 0 Component Obsoletes availability C%) (6) Amount purchased (plece or liters) Order size Bias Component Pack 1 or 92.3% 549,236 43 17,081 126,331 0.0% 99.2% 0.1% 3,401,935 595,239 PET 83.7% 818,922 42 44.788 77 196,465 0.0% 99.8% 0.0% 5,386,209 905,651 Orange 97.9% 153,211 4.5 67,303 108 33.800 0.0% 99.1% 0.0% 389,489 163,085 Mango 93.7 13,571 4.5 13,474 7.7 3,016 0.0% 100.0% 0.0% 78.476 14,701 Vitamin 80.8% 729 349 18.4 178 0.0% 8249 0.2% 4.693 974 Stock development Pack 1 liter PET Orange | Mwan MW 20 40 60 80 100 120 on an in son 12 en
Step by Step Solution
There are 3 Steps involved in it

Get step-by-step solutions from verified subject matter experts