

Question: Now let's turn our attention to the internal Argus flow record data. Searching for traffic relating to the attacker, 172.30.1.77 and port 22, we see:
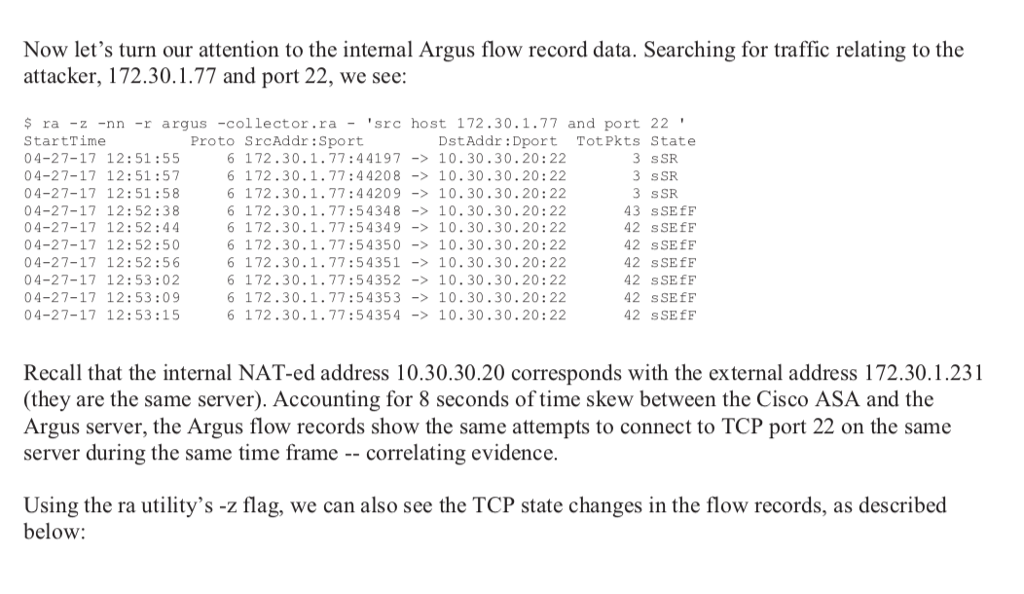
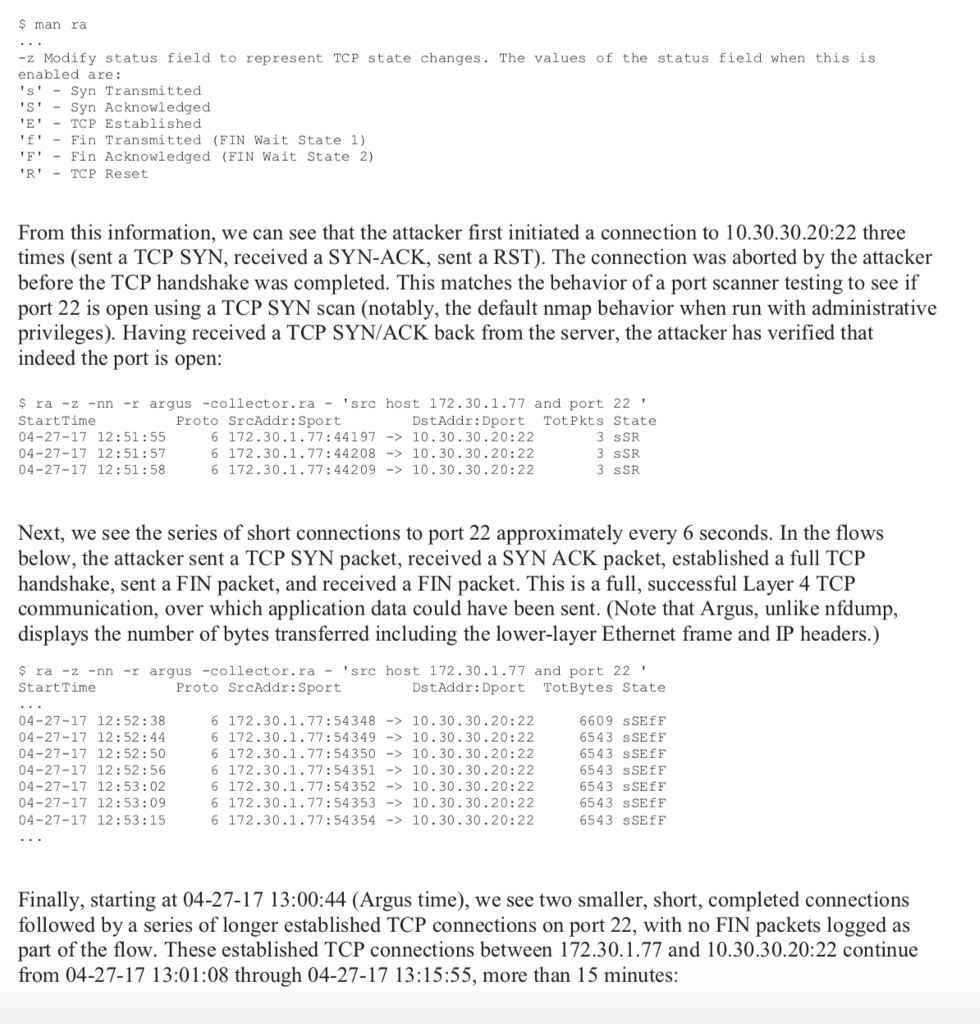
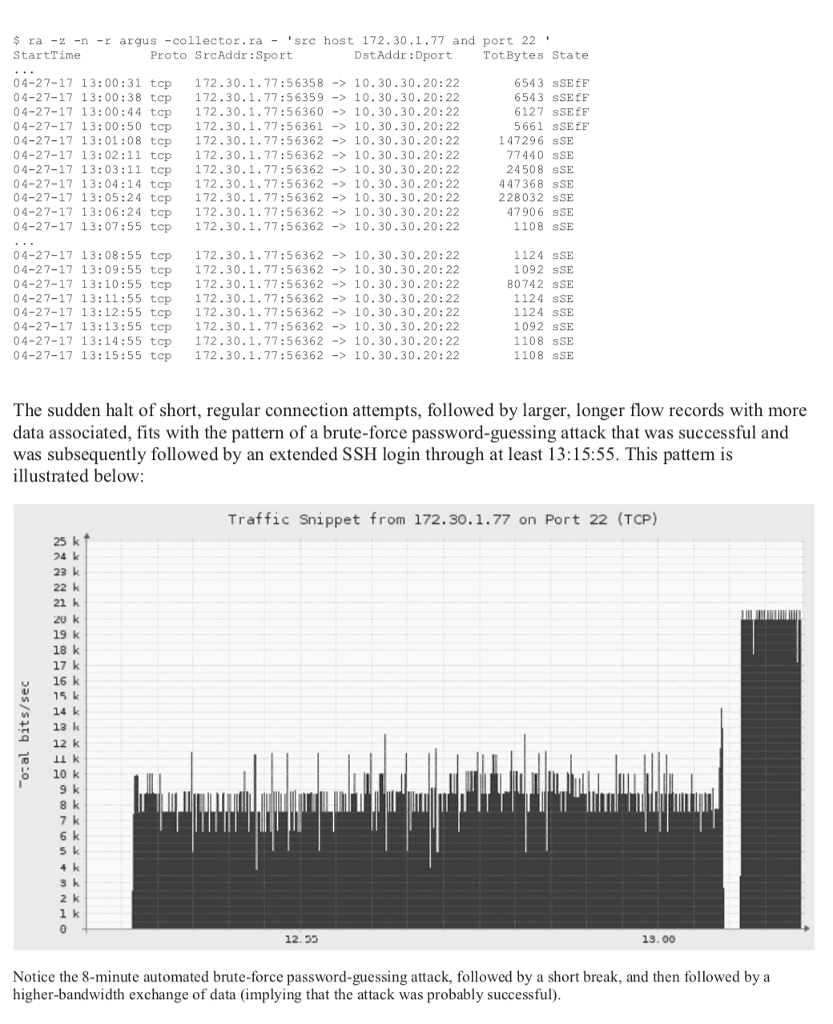
Now let's turn our attention to the internal Argus flow record data. Searching for traffic relating to the attacker, 172.30.1.77 and port 22, we see: $ ra -z -nn -r argus -collector.ra -src host 172.30.1.77 and port 22' StartTime 04-27-17 12:51:55 04-27-17 12:51:57 04-27-17 12:51:58 04-27-17 12:52:38 04-27-17 12: 52:44 04-27-17 12:52:50 04-27-17 12: 52:56 04-27-17 12:53:02 04-27-17 12:53:09 04-27-17 12:53:15 Proto SrcAddr:Sport DstAddr: Dport TotPkts State 6 172.30.1.77:44197-10.30.30.20:22 6 172.30.1.77:44208-> 10.30.30.20:22 6 172.30.1.77:44209-10.30.30.20: 22 6 172.30.1.77:54348-> 10.30.30.20:22 6 172.30.1.77:54349 -10.30.30.20:22 6 172.30.1.77:54350-> 10.30.30.20:22 6 172.30.1.77:54351->10.30.30.20:22 6 172.30.1.77:54352-> 10.30.30.20:22 6 172.30.1.77:54353->10.30.30.20:22 6 172.30.1.77:54354- 10.30.30.20:22 3 sSR 3 sSR 3 sSR 43 sSEfF 42 sSEfF 42 sSEEF 42 sSEfF 42 sSEEF 42 sSEfF 42 sSEEF Recall that the internal NAT-ed address 10.30.30.20 corresponds with the external address 172.30.1.231 (they are the same server). Accounting for 8 seconds of time skew between the Cisco ASA and the Argus server, the Argus flow records show the same attempts to connect to TCP port 22 on the same server during the same time frame correlating evidence. Using the ra utility's -z flag, we can also see the TCP state changes in the flow records, as described below
Step by Step Solution
There are 3 Steps involved in it

Get step-by-step solutions from verified subject matter experts