

Question: Now use the following data set for the same common stock, which presents the adjusted close prices. Compute the total daily return (holding period return)
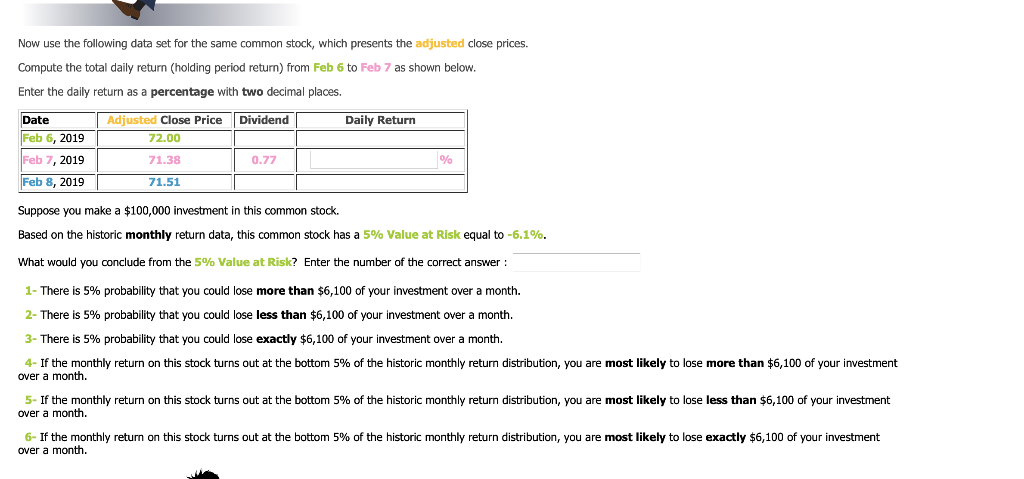
Now use the following data set for the same common stock, which presents the adjusted close prices. Compute the total daily return (holding period return) from Feb 6 to Feb 7 as shown below. Enter the daily return as a percentage with two decimal places. Dividend Daily Return Date Feb 6, 2019 Feb 7, 2019 Feb 8, 2019 Adjusted Close Price 72.00 71.38 0.77 71.51 Suppose you make a $100,000 investment in this common stock. Based on the historic monthly return data, this common stock has a 5% Value at Risk equal to -6.1%. What would you conclude from the 5% Value at Risk? Enter the number of the correct answer : 1- There is 5% probability that you could lose more than $6,100 of your investment over a month. 2- There is 5% probability that you could lose less than $6,100 of your investment over a month. 3- There is 5% probability that you could lose exactly $6,100 of your investment over a month. 4- If the monthly return on this stock turns out at the bottom 5% of the historic monthly return distribution, you are most likely to lose more than $6,100 of your investment over a month. 5- If the monthly return on this stock turns out at the bottom 5% of the historic monthly return distribution, you are most likely to lose less than $6,100 of your investment over a month. 6- If the monthly return on this stock turns out at the bottom 5% of the historic monthly return distribution, you are most likely to lose exactly $6,100 of your investment over a month
Step by Step Solution
There are 3 Steps involved in it

Get step-by-step solutions from verified subject matter experts