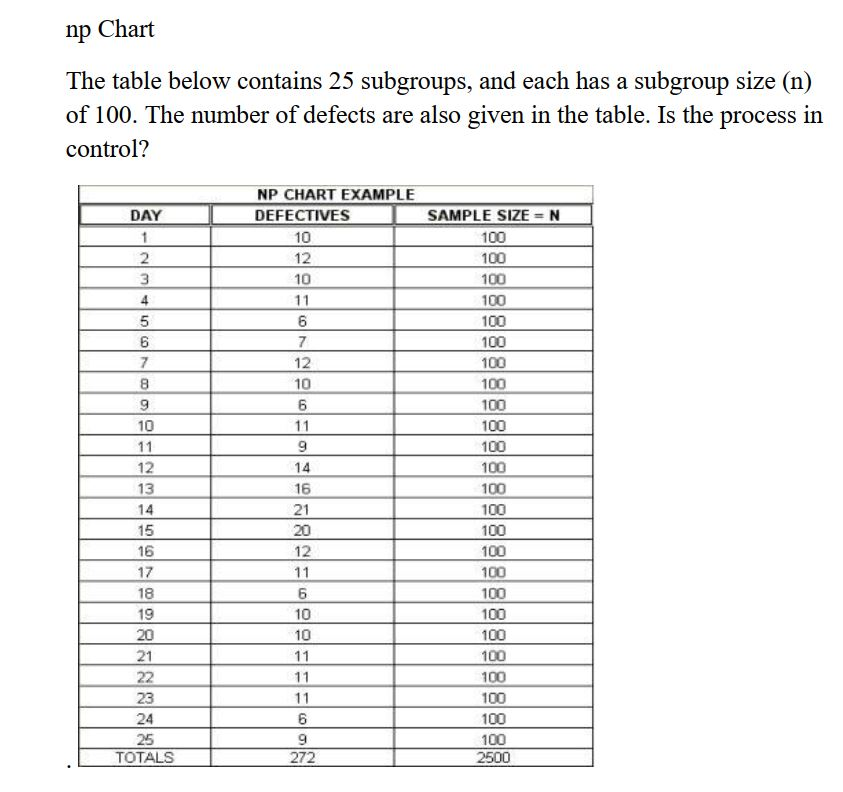
Question: np Chart The table below contains 25 subgroups, and each has a subgroup size (n) of 100. The number of defects are also given in

np Chart The table below contains 25 subgroups,

np Chart The table below contains 25 subgroups, and each has a subgroup size (n) of 100. The number of defects are also given in the table. Is the process in control? NP CHART EXAMPLE DEFECTIVES DAY 10 SAMPLE SIZE = N 100 100 100 100 100 100 00 100 On 100 10n 100 100 10 11 100 100 100 100 2500

Step by Step Solution

There are 3 Steps involved in it

1 Expert Approved Answer
Step: 1 Unlock blur-text-image
Question Has Been Solved by an Expert!

Get step-by-step solutions from verified subject matter experts

Step: 2 Unlock
Step: 3 Unlock

Students Have Also Explored These Related General Management Questions!