

Question: NPar Tests Descriptive Statistics Percentiles N Mean Std. Deviation Minimum Maximum 25th 50th (Median) 75th familarity_construct 113 4.5280 2.25934 1.00 7.00 2.1667 5.0000 6.6667 Age_Categories
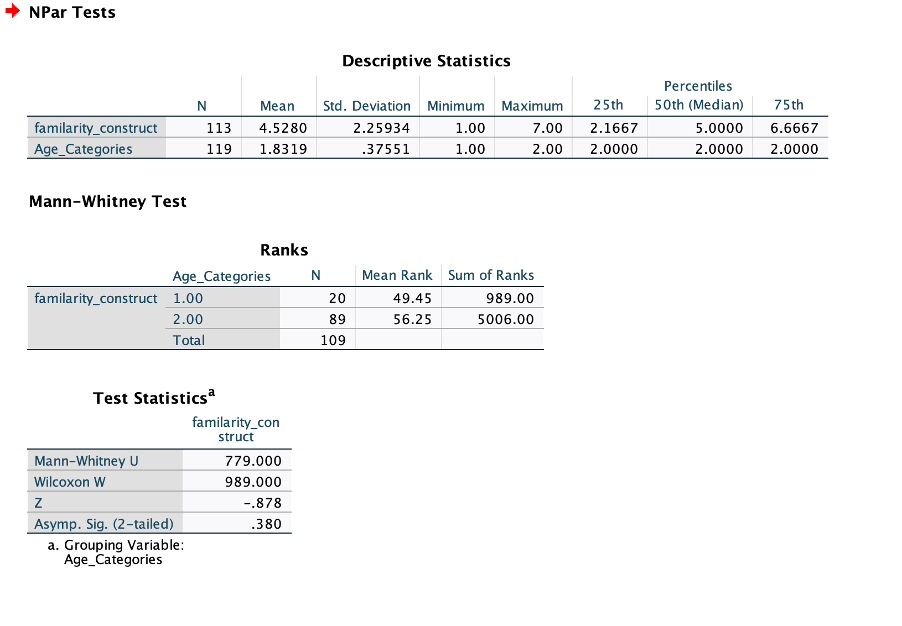
NPar Tests Descriptive Statistics Percentiles N Mean Std. Deviation Minimum Maximum 25th 50th (Median) 75th familarity_construct 113 4.5280 2.25934 1.00 7.00 2.1667 5.0000 6.6667 Age_Categories 119 1.8319 37551 1.00 2.00 2.0000 2.0000 2.0000 Mann-Whitney Test Ranks Age_Categories N Mean Rank Sum of Ranks familarity_construct 1.00 20 49.45 989.00 2.00 89 56.25 5006.00 Total 109 Test Statistics familarity_con struct Mann-Whitney U 779.000 Wilcoxon W 989.000 Z -.878 Asymp. Sig. (2-tailed) 380 a. Grouping Variable: Age_Categories
Step by Step Solution
There are 3 Steps involved in it
1 Expert Approved Answer
Step: 1 Unlock

Question Has Been Solved by an Expert!
Get step-by-step solutions from verified subject matter experts
Step: 2 Unlock
Step: 3 Unlock