

Question: number 1 Find the t values that form the boundaries of the critical region for a two-tailed test with = 0.02 for a sample size
number 1
Find the t values that form the boundaries of the critical region for a two-tailed test with = 0.02 for a sample size of 19.
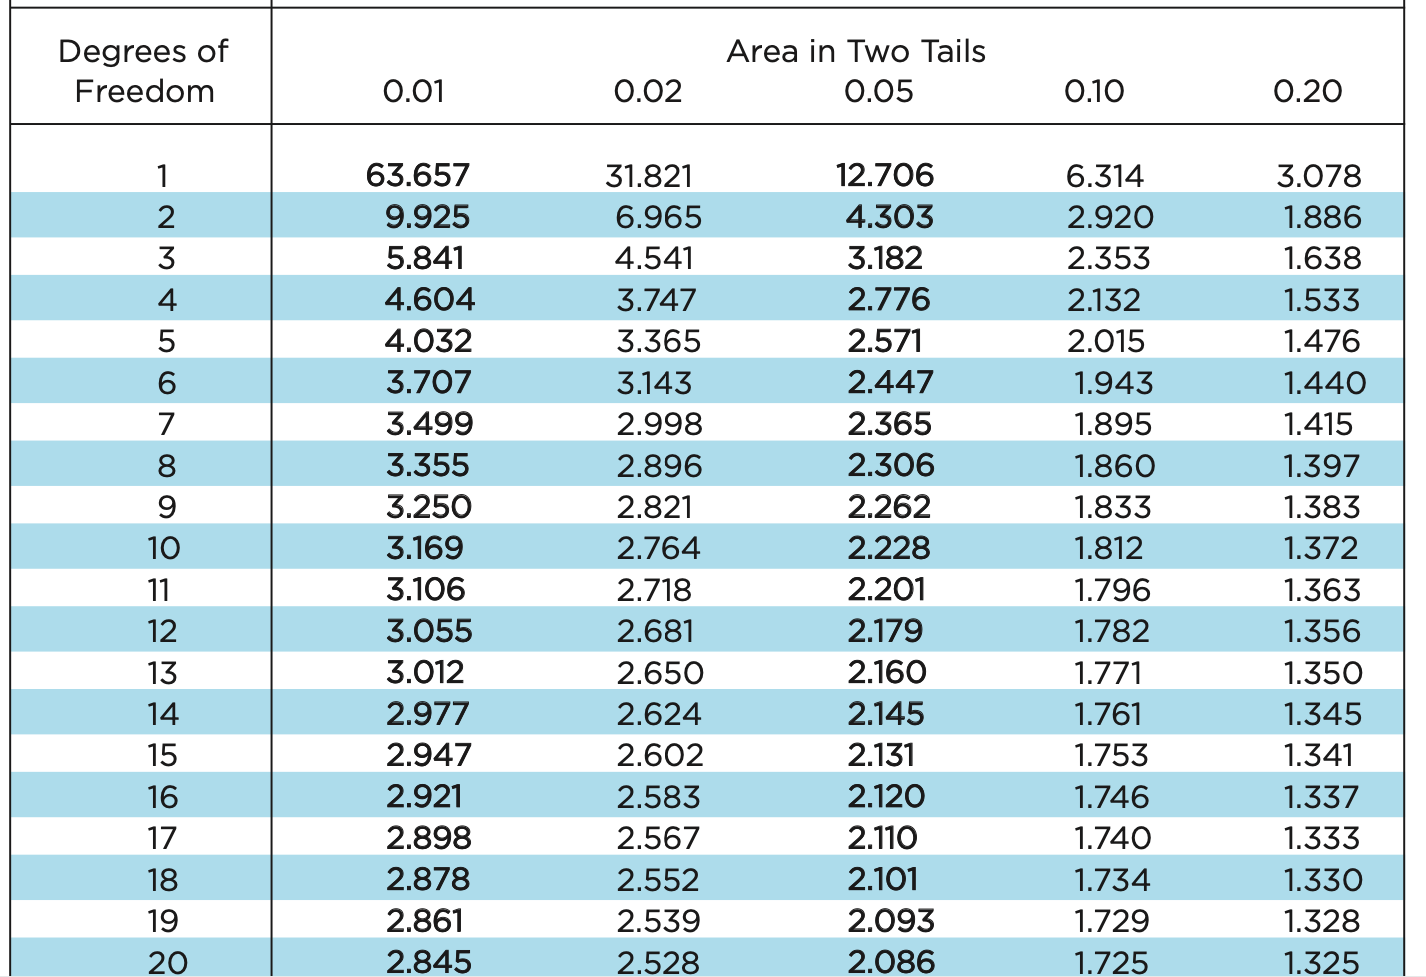

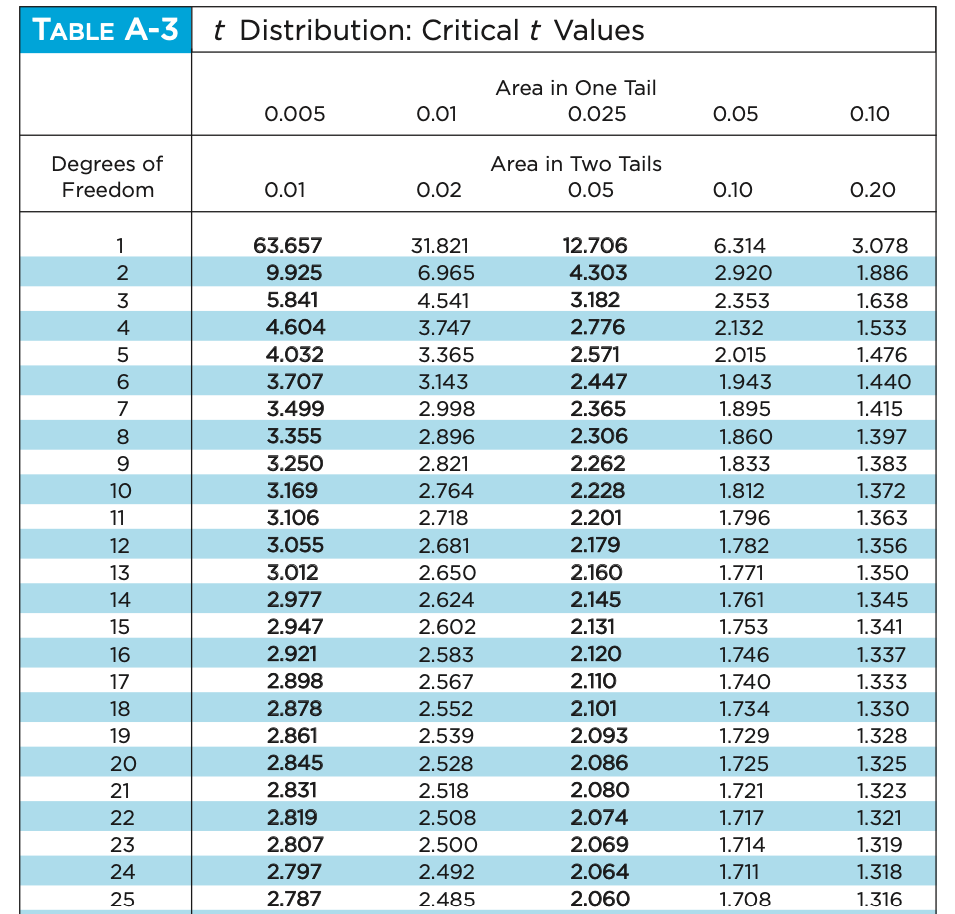
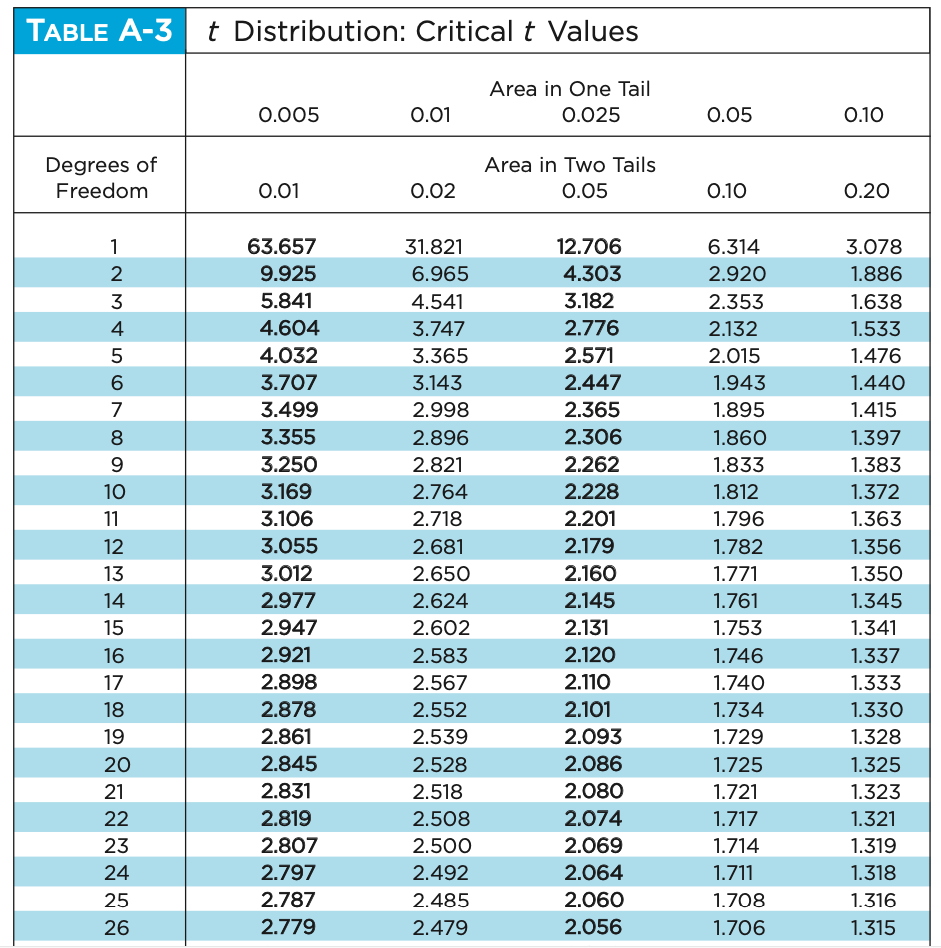
\fTABLE A-3 '5 Distribution: Critical t Values Area in One Tail 0.025 Degrees of Area in Two Tails Freedom 0.01 0.02 0.05 0.10 0.20 1 63.657 31.821 12.706 6.314 3.078 2 9.925 6.965 4.303 2.920 1.886 3 5.841 4.541 3.182 2.353 1.638 4 4.604 3.747 2.776 2.132 1.533 5 4.032 3.365 2.571 2.015 1.476 6 3.707 3.143 2.447 1.943 1.440 7 3.499 2.998 2.365 1.895 1.415 8 3.355 2.896 2.306 1.860 1.397 9 3.250 2.821 2.262 1.833 1.383 10 3.169 2.764 2.228 1.812 1.372 11 3.106 2.718 2.201 1.796 1.363 12 3.055 2.681 2.179 1.782 1.356 13 3.012 2.650 2.160 1.771 1.350 14 2.977 2.624 2.145 1.761 1.345 15 2.947 2.602 2.131 1.753 1.341 16 2.921 2.583 2.120 1.746 1.337 17 2.898 2.567 2.110 1.740 1.333 18 2.878 2.552 2.101 1.734 1.330 19 2.861 2.539 2.093 1.729 1.328 20 2.845 2.528 2.086 1.725 1.325 21 2.831 2.518 2.080 1.721 1.323 22 2.819 2.508 2.074 1.717 1.321 23 2.807 2.500 2.069 1.714 1.319 24 2.797 2.492 2.064 1.711 1.318 25 2.787 2.485 2.060 1.708 1.316 TABLE A-3 '5 Distribution: Critical t Values Area in One Tail 0.025 Degrees of Area in Two Tails Freedom 0.01 0.02 0.05 0.10 0.20 1 63.657 31.821 12.706 6.314 3.078 2 9.925 6.965 4.303 2.920 1.886 3 5.841 4.541 3.182 2.353 1.638 4 4.604 3.747 2.776 2.132 1.533 5 4.032 3.365 2.571 2.015 1.476 6 3.707 3.143 2.447 1.943 1.440 7 3.499 2.998 2.365 1.895 1.415 8 3.355 2.896 2.306 1.860 1.397 9 3.250 2.821 2.262 1.833 1.383 10 3.169 2.764 2.228 1.812 1.372 11 3.106 2.718 2.201 1.796 1.363 12 3.055 2.681 2.179 1.782 1.356 13 3.012 2.650 2.160 1.771 1.350 14 2.977 2.624 2.145 1.761 1.345 15 2.947 2.602 2.131 1.753 1.341 16 2.921 2.583 2.120 1.746 1.337 17 2.898 2.567 2.110 1.740 1.333 18 2.878 2.552 2.101 1.734 1.330 19 2.861 2.539 2.093 1.729 1.328 20 2.845 2.528 2.086 1.725 1.325 21 2.831 2.518 2.080 1.721 1.323 22 2.819 2.508 2.074 1.717 1.321 23 2.807 2.500 2.069 1.714 1.319 24 2.797 2.492 2.064 1.711 1.318 25 2.787 2.485 2.060 1.708 1.316 TABLE A-3 t Distribution: Critical t Values Area in One Tail 0.005 0.01 0.025 0.05 0.10 Degrees of Area in Two Tails Freedom 0.01 0.02 0.05 0.10 0.20 63.657 31.821 12.706 6.314 3.078 9.925 6.965 4.303 2.920 1.886 5.841 4.541 3.182 2.353 1.638 OUT A WN - 4.604 3.747 2.776 2.132 1.533 4.032 3.365 2.571 2.015 1.476 3.707 3.143 2.447 1.943 1.440 3.499 2.998 2.365 1.895 1.415 3.355 2.896 2.306 1.860 1.397 3.250 2.821 2.262 1.833 1.383 3.169 2.764 2.228 1.812 1.372 3.106 2.718 2.201 1.796 1.363 12 3.055 2.681 2.179 1.782 1.356 13 3.012 2.650 2.160 1.771 1.350 14 2.977 2.624 2.145 1.761 1.345 15 2.947 2.602 2.131 1.753 1.341 16 2.921 2.583 2.120 1.746 1.337 17 2.898 2.567 2.110 1.740 1.333 18 2.878 2.552 2.101 1.734 1.330 19 2.861 2.539 2.093 1.729 1.328 20 2.845 2.528 2.086 1.725 1.325 21 2.831 2.518 2.080 1.721 1.323 22 2.819 2.508 2.074 1.717 1.321 23 2.807 2.500 2.069 1.714 1.319 24 2.797 2.492 2.064 1.711 1.318 25 2.787 2.485 2.060 1.708 1.316 26 2.779 2.479 2.056 1.706 1.315
Step by Step Solution
There are 3 Steps involved in it

Get step-by-step solutions from verified subject matter experts