

Question: PART 1 PLEASE COMPLETE WITH SHOWING WORK IF NECCESSARY AND NUMBER EACH ANSWER FOR BEST FEEDBACK. 1. Under what circumstances is a t statistic used
PART 1
PLEASE COMPLETE WITH SHOWING WORK IF NECCESSARY AND NUMBER EACH ANSWER FOR BEST FEEDBACK.
1. Under what circumstances is a t statistic used instead of a z-score for a hypothesis test?
2. A sample of n = 16 scores has a mean of M= 56 and a standard deviation of s = 20.
a. Explain what is measured by the sample standard deviation.
b. Compute the estimated standard error for the sample mean and explain what is measured by the standard error.
3. Find the estimated standard error for the sample mean for each of the following samples.
a. n = 9 with SS= 1152
b. n = 16 with SS = 540
c. n = 25 with SS = 600
4. The following sample of n = 4 scores were obtained from a population with unknown parameters. Scores: 2, 2, 6, 2
a. Compute the sample mean and standard deviation. (Note that these are descriptive values that summarize the sample data.)
b. Compute the estimated standard error for M. (Note that this is an inferential value that describes how accurately the sample mean represents the unknown population mean.)
5. The following sample was obtained from a population with unknown parameters.
Scores: 13, 7, 6, 12, 0, 4
a. Compute the sample mean and standard deviation. (Note that these are descriptive values that summarize the sample data.)
b. Compute the estimated standard error for M. (Note that this is an inferential value that describes how accurately the sample mean represents the unknown population mean.)
7. Find the t values that form the boundaries of the critical region for a two-tailed test with a 5 .05 for each of the following sample sizes:
a. n = 4
b. n = 15
c. n = 24
(practice using table of t-values)
PART 2
1. Describe the basic characteristics that define an independent-measures, or a between-subjects, research study.
2. Describe what is measured by the estimated standard error in the bottom of the independent-measures tstatistic.
3. One sample has SS = 36 and a second sample has SS = 24.
a. If n 5 5 for both samples, find each of the sample variances and compute the pooled variance. Because the samples are the same size, you should find that the pooled variance is exactly halfway between the two sample variances.
b. Now assume that n = 5 for the first sample and n = 13 for the second. Again, calculate the two sample variances and the pooled variance. You should find that the pooled variance is closer to the variance for the larger sample.
4. One sample has SS = 60 and a second sample has SS = 48.
a. If n = 7 for both samples, find each of the sample variances, and calculate the pooled variance. Because the samples are the same size, you should find that the pooled variance is exactly halfway between the two sample variances.
b. Now assume that n = 7 for the first sample and n = 5 for the second. Again, calculate the two sample variances and the pooled variance. You should find that the pooled variance is closer to the variance for the larger sample
5. Two separate samples, each with n = 9 individuals, receive different treatments. After treatment, the first sample has SS = 546 and the second has SS = 606.
a. Find the pooled variance for the two samples.
b. Compute the estimated standard error for the sample mean difference.
c. If the sample mean difference is 8 points, is this enough to reject the null hypothesis and conclude that there is a significant difference for a two-tailed test at the .05 level?
(Q7 and Q9 are full-on independent samples t-tests - the problems before that address parts of the process.)
Q7 - use a p value of .05 instead of the .01 mentioned in the problem; we will ALWAYS use .05. Be sure you know what that means! It means that we are accepting a 5% chance that the conclusion we make about the population based on the sample (i.e., the hypothesis test) is incorrect.
In the problem, you see the raw scores but also the means and sums of squares for each of the groups of 10research participants. Q7 - use a p value of .05 instead of the .01 mentioned in the problem; we will ALWAYS use .05. Be sure you know what that means! It means that we are accepting a 5% chance that the conclusion we make about the population based on the sample (i.e., the hypothesis test) is incorrect.
In the problem, you see the raw scores but also the means and sums of squares for each of the groups of 10research participants.
7. Research results suggest a relationship between the TV viewing habits of 5-year-old children and their future performance in high school. For example, Anderson, Huston, Wright, and Collins (1998) report that high school students who regularly watched Sesame Street as children had better grades in high school than their peers who did not watch Sesame Street. Suppose that a researcher intends to examine this phenomenon using a sample of 20 high school students. The researcher first surveys the students' parents to obtain information on the family's TV viewing habits during the time that the students were 5 years old. Based on the survey results, the researcher selects a sample of n = 10 students with a history of watching Sesame Street and a sample of n = 10 students who did not watch the program. The average high school grade is recorded for each student and the data are as follows:
Average High School Grade
Watched Sesame Street Did Not Watch Sesame Street
86 99 90 79
87 97 89 83
91 94 82 86
97 89 83 81
98 92 85 92
_____________________________________________________________________________________________
n = 10 n = 10
M = 93 M = 85
SS = 200 SS= 160
Use an independent-measures t-test with a = .01 to determine whether there is a significant difference between the two types of a high school students.
9. A long history of psychology research has demonstrated that memory is usually improved by studying material on multiple occasions rather than one time only. This effect is commonly known as distributed practice or spacing effects. In a recent paper examining this effect, Cepeda et al. (2008) looked at the influence of different delays or gaps between study sessions. The results suggest that optimal long-term memory occurs when the study periods are spaced one to three weeks apart. In one part of the study, a group of participants studied a set of obscure trivia facts one day, returned the next day for a second study period, and then tested five weeks later. A second group went through the same procedure but had a one-week gap between the two study sessions. The following data are similar to the results obtained in the study. Do the data indicate a significant difference between the two study conditions? Test with a 5 .05
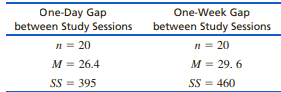
One-Day Gap One-Week Gap between Study Sessions between Study Sessions 20 20 M = 26.4 M 29. 6 55 395 SS = 460
Step by Step Solution
There are 3 Steps involved in it

Get step-by-step solutions from verified subject matter experts