

Question: Number 3 please. Also label graph/keys Please do a nice, neat, complete job. Explain your reasoning at every step. Write in complete sentences, draw careful
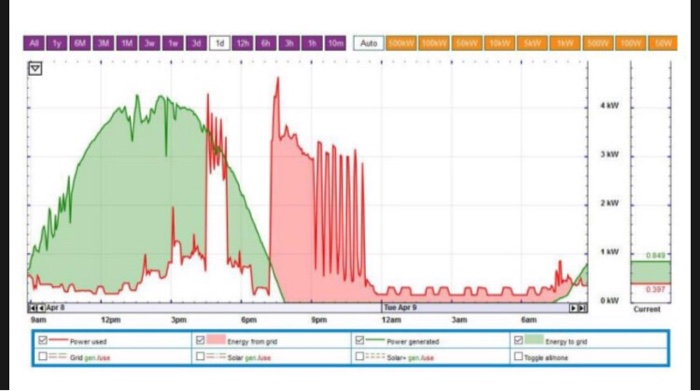
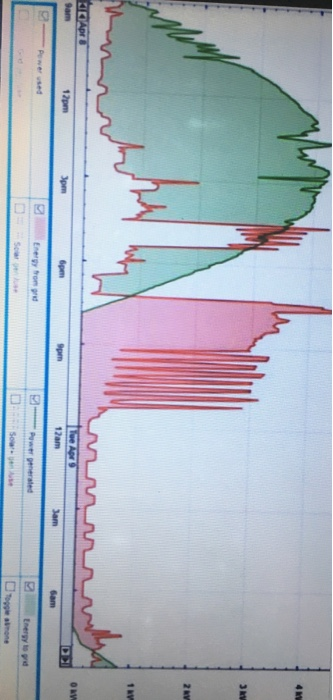
Please do a nice, neat, complete job. Explain your reasoning at every step. Write in complete sentences, draw careful graphs with axes labeled, etc. You can use MATLAB for your graphing if you want to, but you don't have to. (You can do it by hand.) The graph on the last page depicts power generation and power consumption at a home in Austin TX on April 8/9 in 2018. The green curve represents power generated from solar cells installed at the home. The red curve represents power usage at the home. The vertical axis is the power axis. The range is 0-6 kilowatts (kW). The horizontal axis is the time axis. The domain is from 9 AM Monday to 9 AM Tuesday. Each of the ticks on the time axis represents 1/2 hour. (The bolder ticks are spaced 3 hours apart.) Here are the questions you need to answer. For any question requiring Riemann sums, please use rectangles of baselength AT MOST one hour. (You can use shorter baselengths if you really want to.) Be consistent in your choice of points within each subinterval: use left endpoints, right endpoints, or midpoints, but don't mix and match. (If you want to do something clever like trapezoids, go ahead, but please explain what you're doing.) 1. Let's consider the green curve, between any two points in time on the domain, say t = a and t = b. What quantity does the area under this curve, between these two points, represent? What are the units for this quantity? 2. Now let's consider the red curve, between any two points in time on the domain, say t = a and t = b. What quantity does the area under this curve, between these two points, represent? What are the units for this quantity? 3. Let's now think of the starting point of the 24-hour period as t = 0. For this 24-hour period, sketch the following two quantities, on the same set of axes (you'll need to draw a new picture; that is, don't do this on top of the graph supplied): (a) A graph of cumulative energy generated since t = 0; (b) A graph of cumulative energy consumed since t = 0. Al SMMM1 d id 1 1h10m Auto w 1000 SW 10W SW WOW w Current 12 am Sam Energy KICI Apr ON Energy rond Energy to go Please do a nice, neat, complete job. Explain your reasoning at every step. Write in complete sentences, draw careful graphs with axes labeled, etc. You can use MATLAB for your graphing if you want to, but you don't have to. (You can do it by hand.) The graph on the last page depicts power generation and power consumption at a home in Austin TX on April 8/9 in 2018. The green curve represents power generated from solar cells installed at the home. The red curve represents power usage at the home. The vertical axis is the power axis. The range is 0-6 kilowatts (kW). The horizontal axis is the time axis. The domain is from 9 AM Monday to 9 AM Tuesday. Each of the ticks on the time axis represents 1/2 hour. (The bolder ticks are spaced 3 hours apart.) Here are the questions you need to answer. For any question requiring Riemann sums, please use rectangles of baselength AT MOST one hour. (You can use shorter baselengths if you really want to.) Be consistent in your choice of points within each subinterval: use left endpoints, right endpoints, or midpoints, but don't mix and match. (If you want to do something clever like trapezoids, go ahead, but please explain what you're doing.) 1. Let's consider the green curve, between any two points in time on the domain, say t = a and t = b. What quantity does the area under this curve, between these two points, represent? What are the units for this quantity? 2. Now let's consider the red curve, between any two points in time on the domain, say t = a and t = b. What quantity does the area under this curve, between these two points, represent? What are the units for this quantity? 3. Let's now think of the starting point of the 24-hour period as t = 0. For this 24-hour period, sketch the following two quantities, on the same set of axes (you'll need to draw a new picture; that is, don't do this on top of the graph supplied): (a) A graph of cumulative energy generated since t = 0; (b) A graph of cumulative energy consumed since t = 0. Al SMMM1 d id 1 1h10m Auto w 1000 SW 10W SW WOW w Current 12 am Sam Energy KICI Apr ON Energy rond Energy to go
Step by Step Solution
There are 3 Steps involved in it

Get step-by-step solutions from verified subject matter experts