

Question: Number of Drinks Sold 5 The scatterplot below shows the relationship between the outside temperature at noon, in degrees Fahrenheit, and the number of
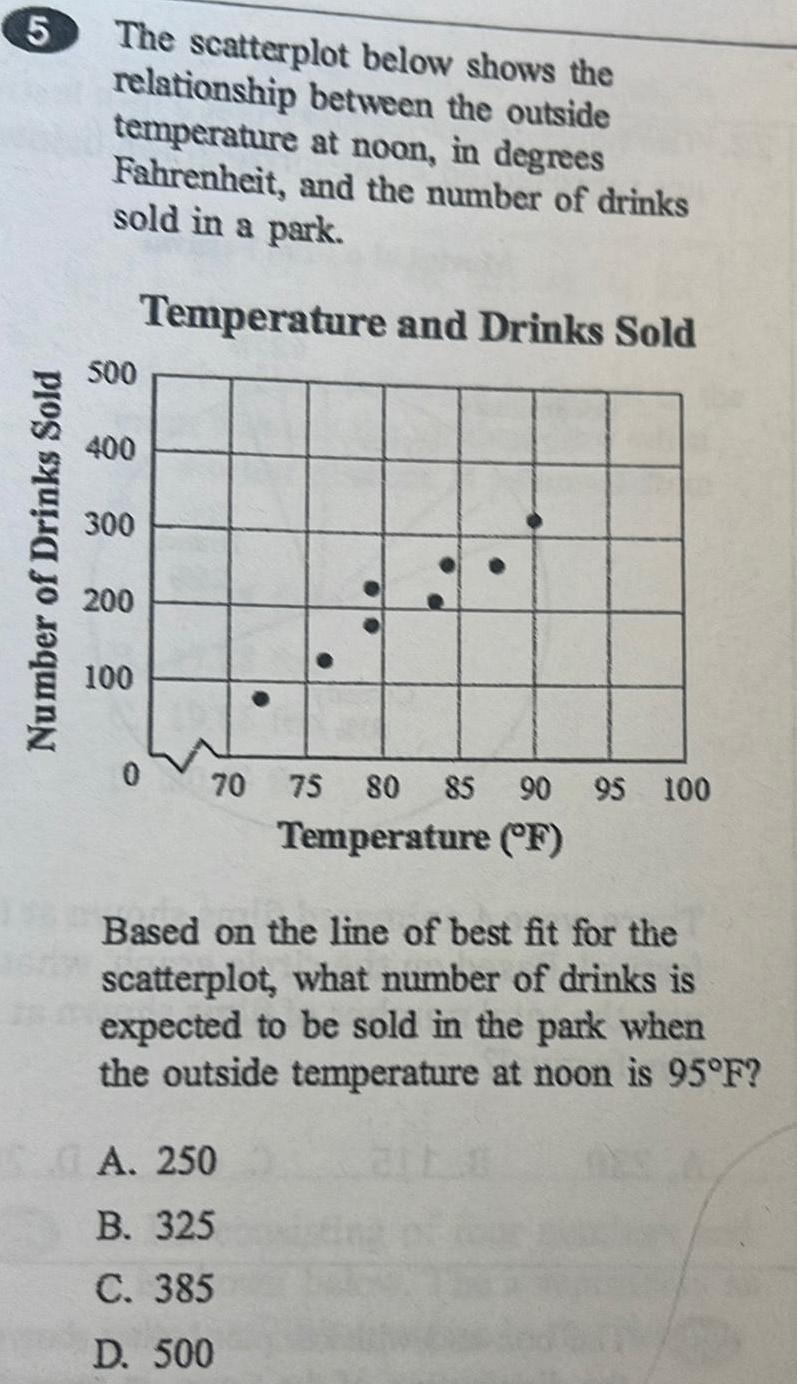
Number of Drinks Sold 5 The scatterplot below shows the relationship between the outside temperature at noon, in degrees Fahrenheit, and the number of drinks sold in a park. 500 Temperature and Drinks Sold 400 300 200 100 0 70 75 80 85 90 90 Temperature (F) 95 100 Based on the line of best fit for the scatterplot, what number of drinks is expected to be sold in the park when the outside temperature at noon is 95F? A. 250 B. 325 C. 385 D. 500
Step by Step Solution
There are 3 Steps involved in it
1 Expert Approved Answer
Step: 1 Unlock

Question Has Been Solved by an Expert!
Get step-by-step solutions from verified subject matter experts
Step: 2 Unlock
Step: 3 Unlock