

Question: 1. Here are scores on a math test from two different classes. Class A: 29, 32, 35, 35, 42, 42, 46, 47, 50, 50,
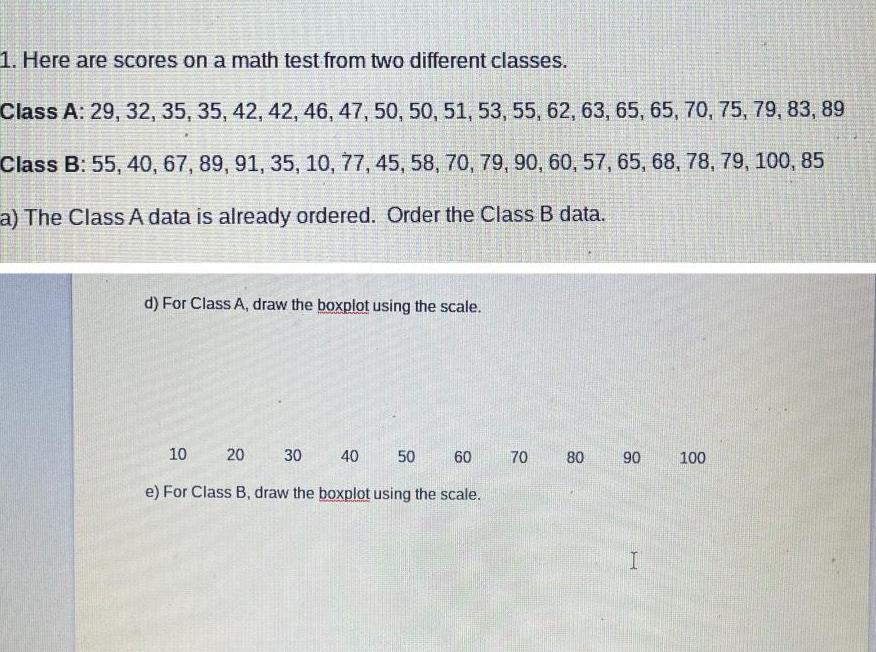
1. Here are scores on a math test from two different classes. Class A: 29, 32, 35, 35, 42, 42, 46, 47, 50, 50, 51, 53, 55, 62, 63, 65, 65, 70, 75, 79, 83, 89 Class B: 55, 40, 67, 89, 91, 35, 10, 77, 45, 58, 70, 79, 90, 60, 57, 65, 68, 78, 79, 100, 85 a) The Class A data is already ordered. Order the Class B data. d) For Class A, draw the boxplot using the scale. 10 20 30 30 40 40 50 50 60 70 80 e) For Class B, draw the boxplot using the scale. 90 90 100 I
Step by Step Solution
There are 3 Steps involved in it
1 Expert Approved Answer
Step: 1 Unlock

Question Has Been Solved by an Expert!
Get step-by-step solutions from verified subject matter experts
Step: 2 Unlock
Step: 3 Unlock