

Question: Number Statistic Std. Error Mean 21.57 0.940 Lower Bound 19.64 95% Confidence Interval for Mean Upper Bound 23.49 5% Trimmed Mean 21.44 Median 21.00 Variance
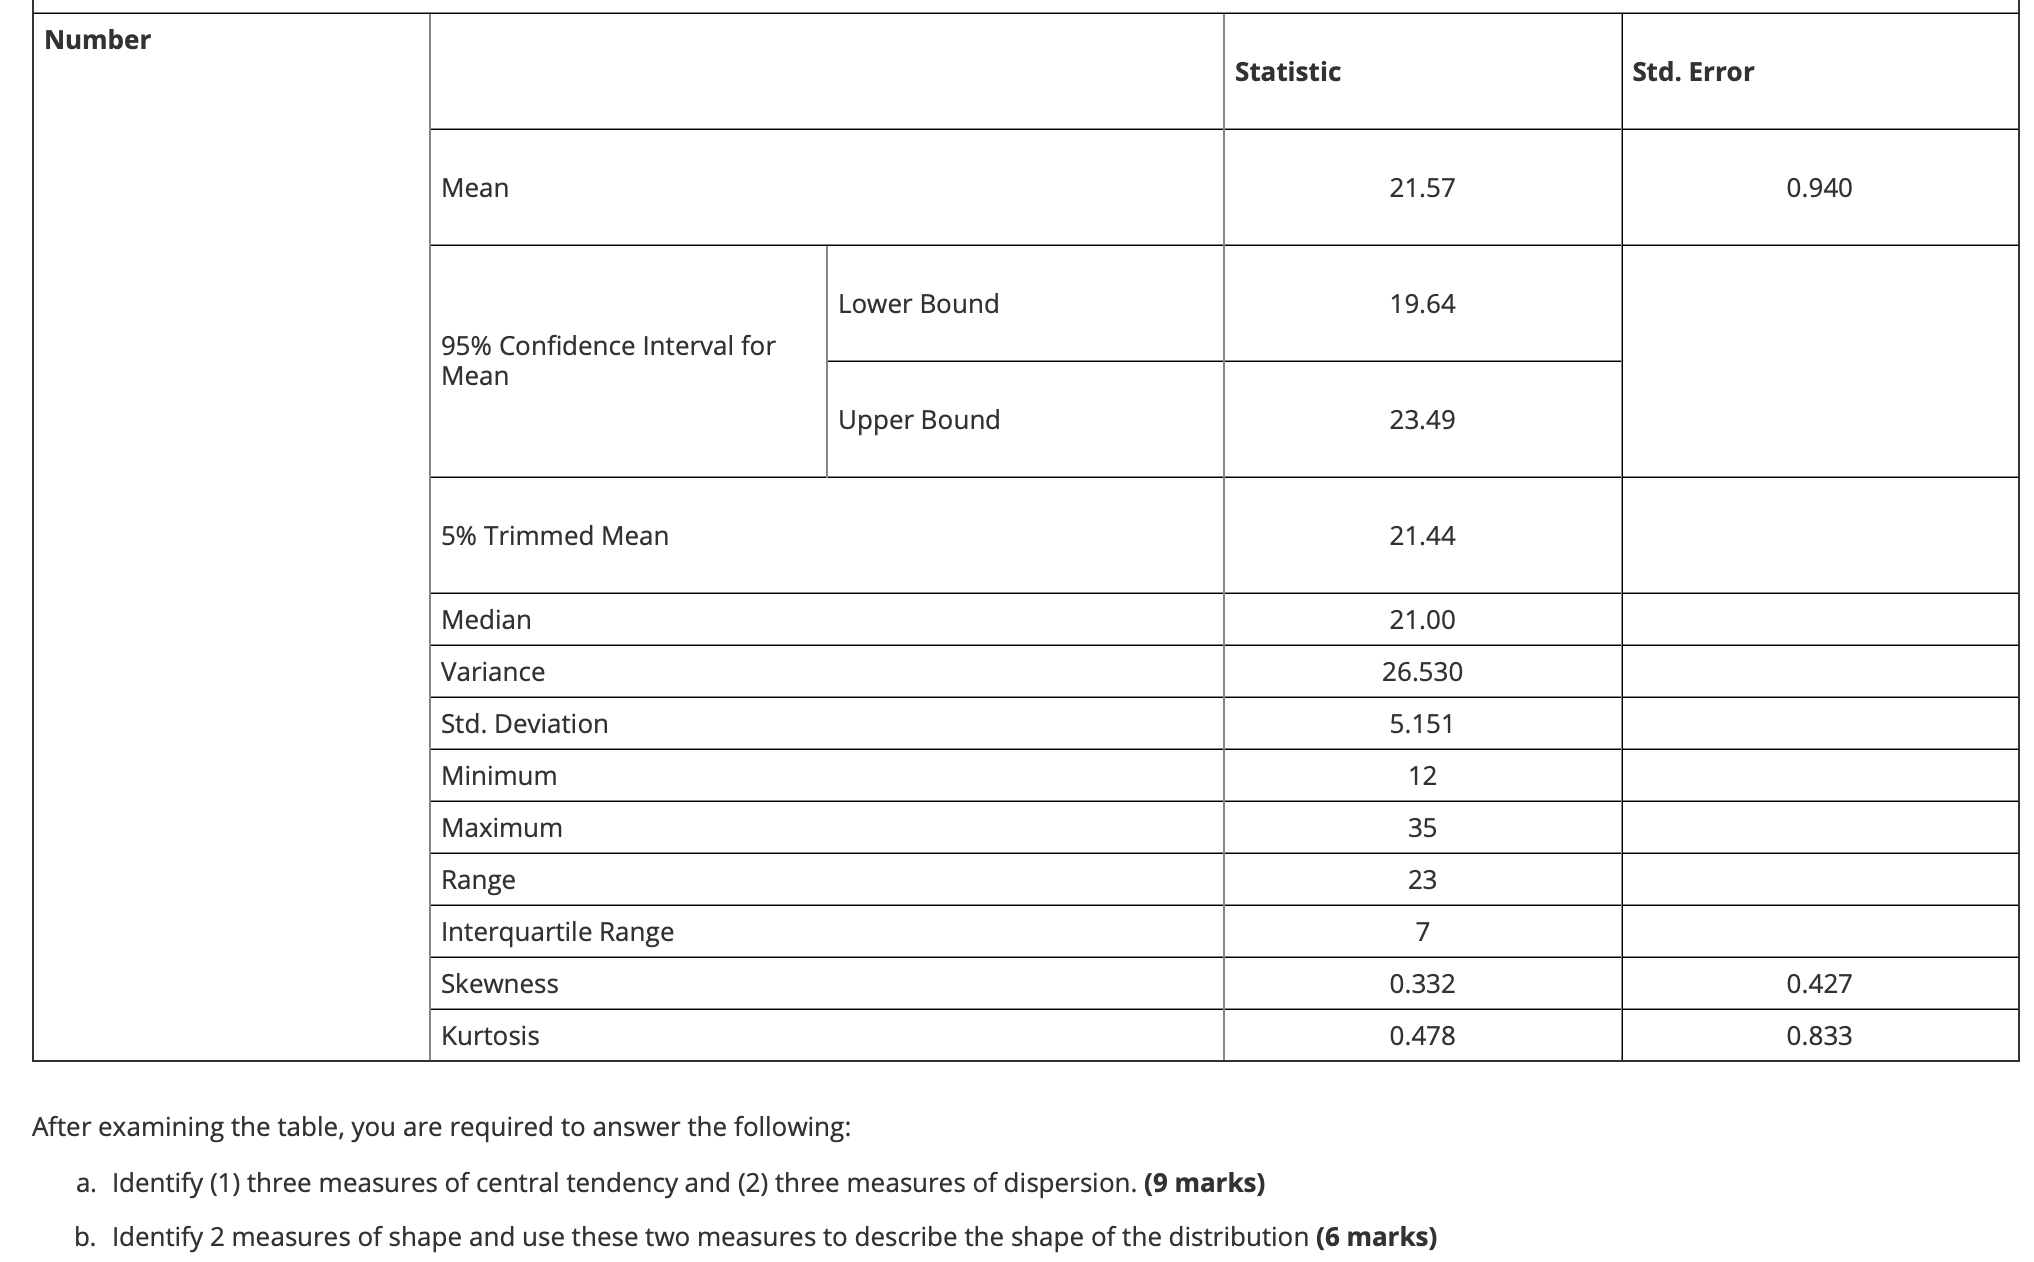
Number Statistic Std. Error Mean 21.57 0.940 Lower Bound 19.64 95% Confidence Interval for Mean Upper Bound 23.49 5% Trimmed Mean 21.44 Median 21.00 Variance 26.530 Std. Deviation 5.151 Minimum 12 Maximum 35 Range 23 Interquartile Range 7 Skewness 0.332 0.427 Kurtosis 0.478 0.833 After examining the table, you are required to answer the following: a. Identify (1) three measures of central tendency and (2) three measures of dispersion. (9 marks) b. Identify 2 measures of shape and use these two measures to describe the shape ofthe distribution (6 marks)
Step by Step Solution
There are 3 Steps involved in it
1 Expert Approved Answer
Step: 1 Unlock

Question Has Been Solved by an Expert!
Get step-by-step solutions from verified subject matter experts
Step: 2 Unlock
Step: 3 Unlock