

Question: Numbers below have already been calculated just need help on how to answer the question for each part. This my homework from my school Grace

Numbers below have already been calculated just need help on how to answer the question for each part. This my homework from my school Grace College.
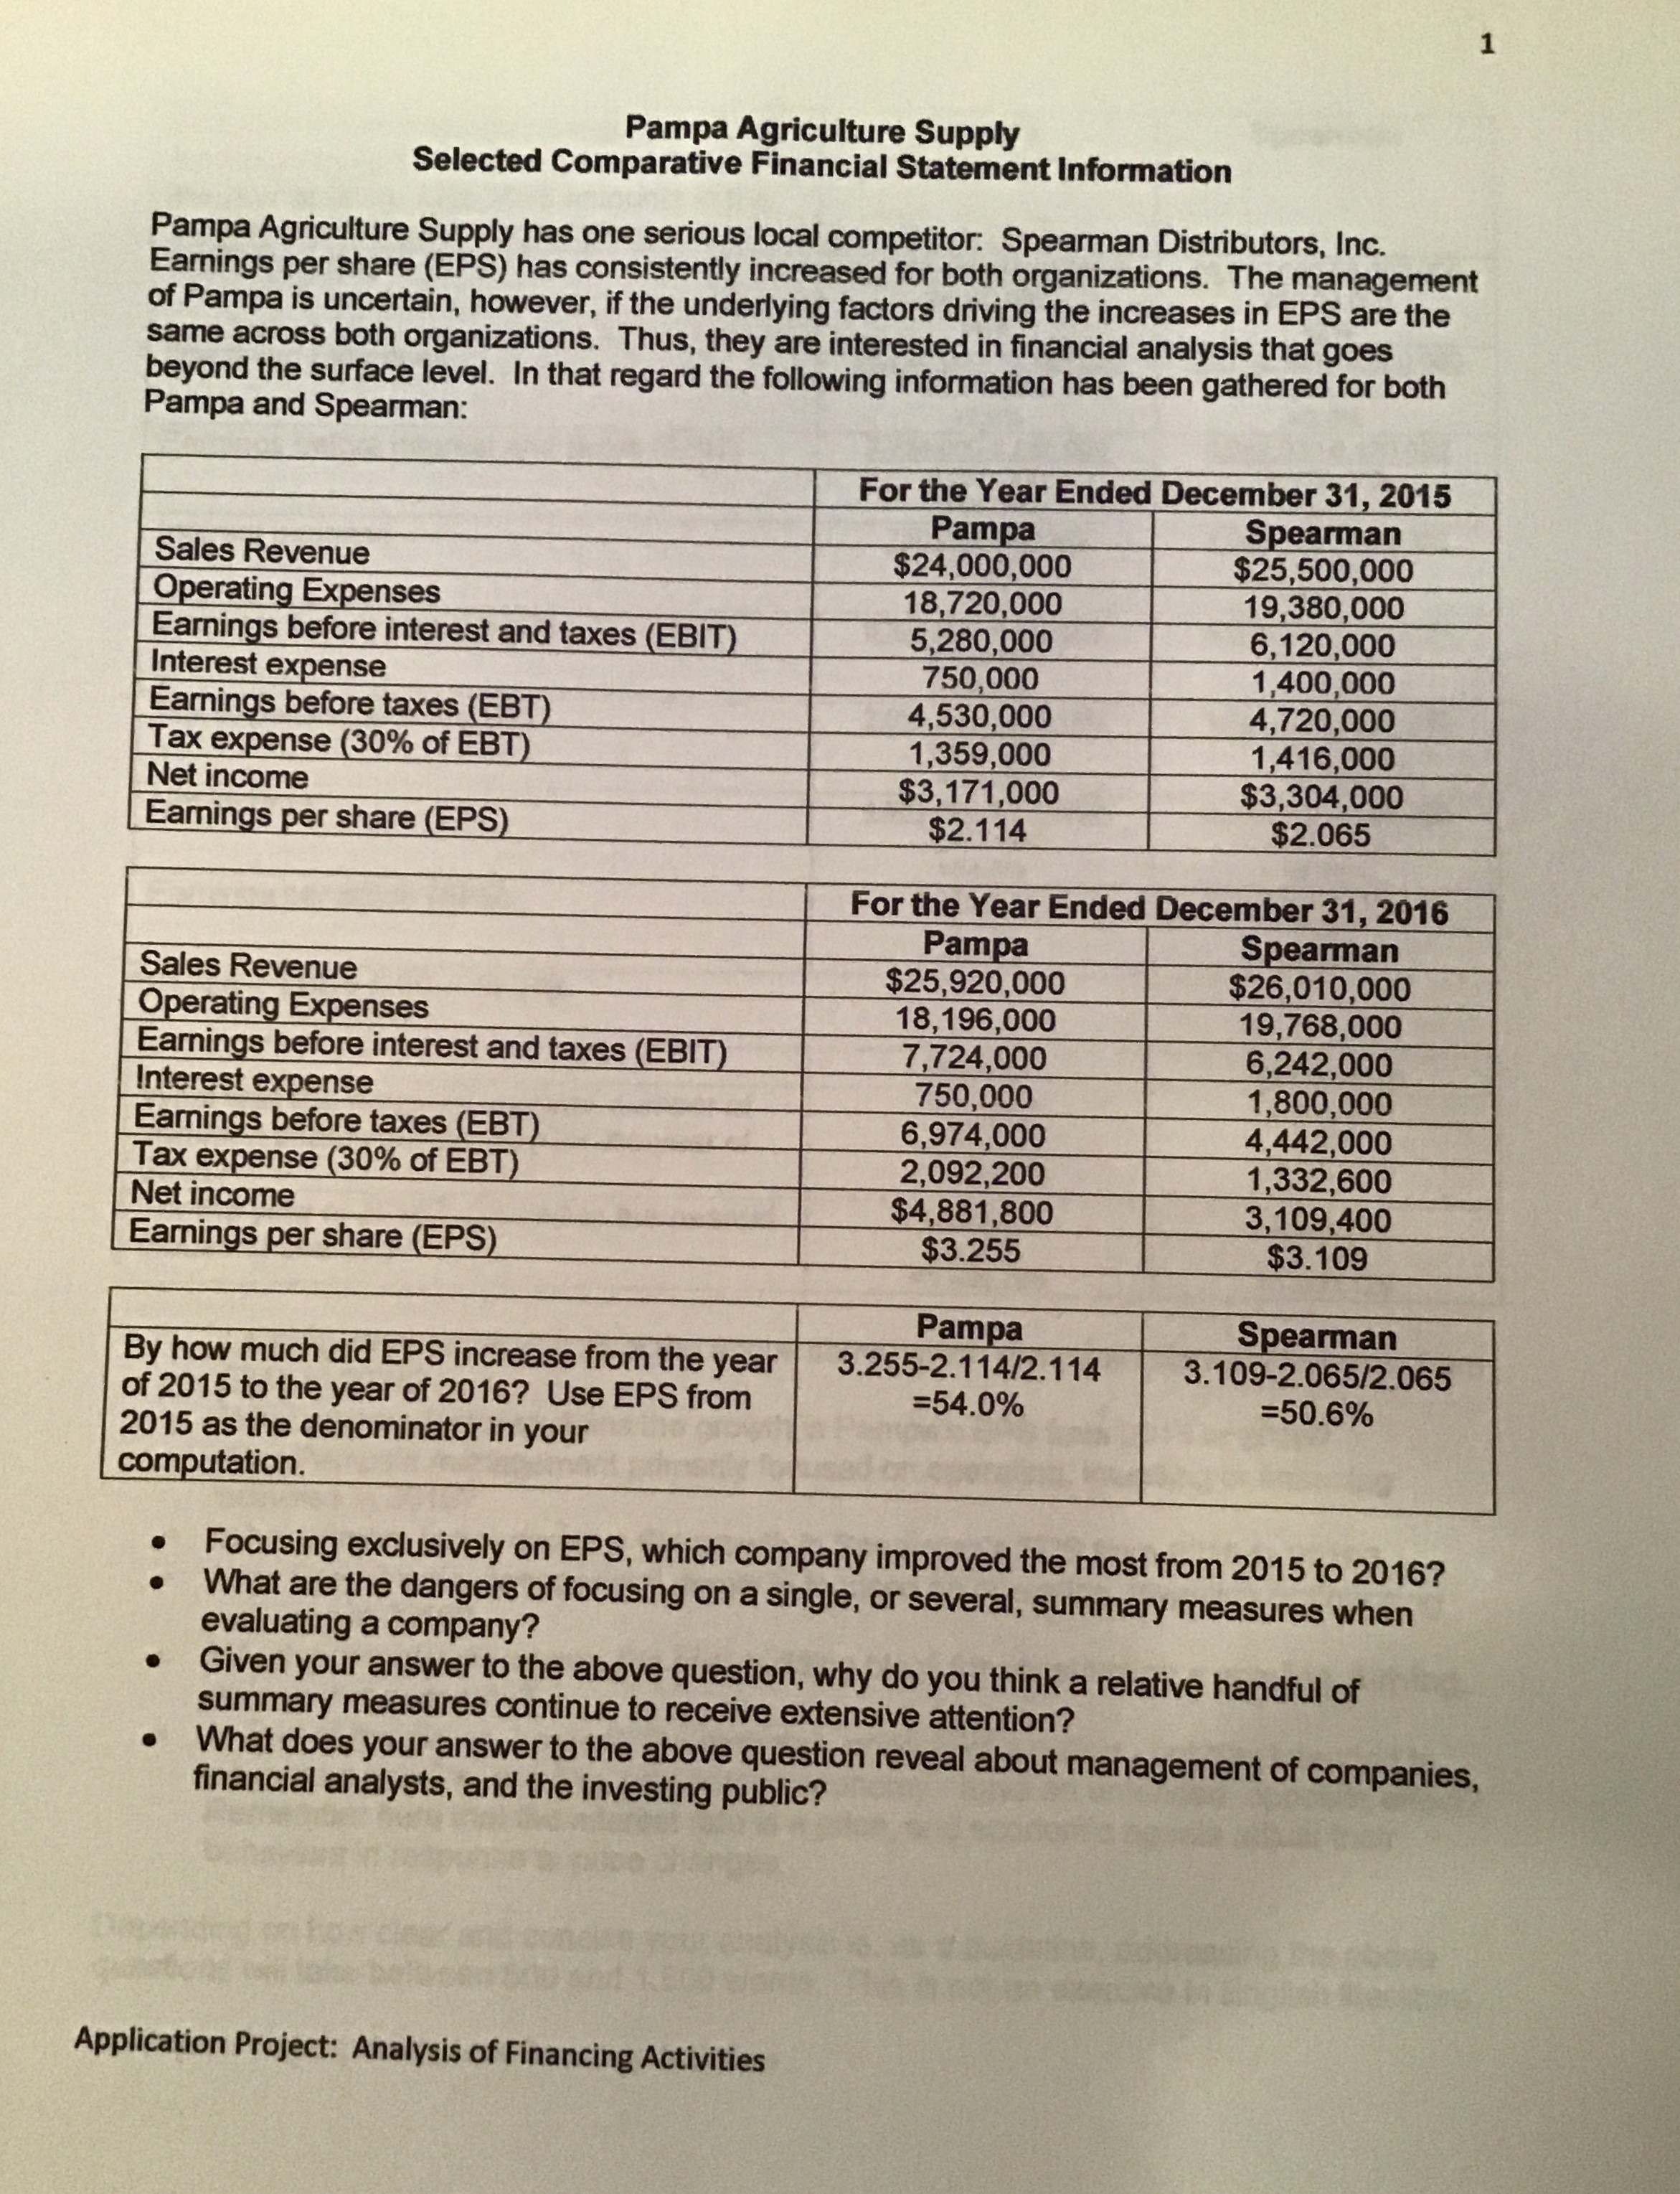

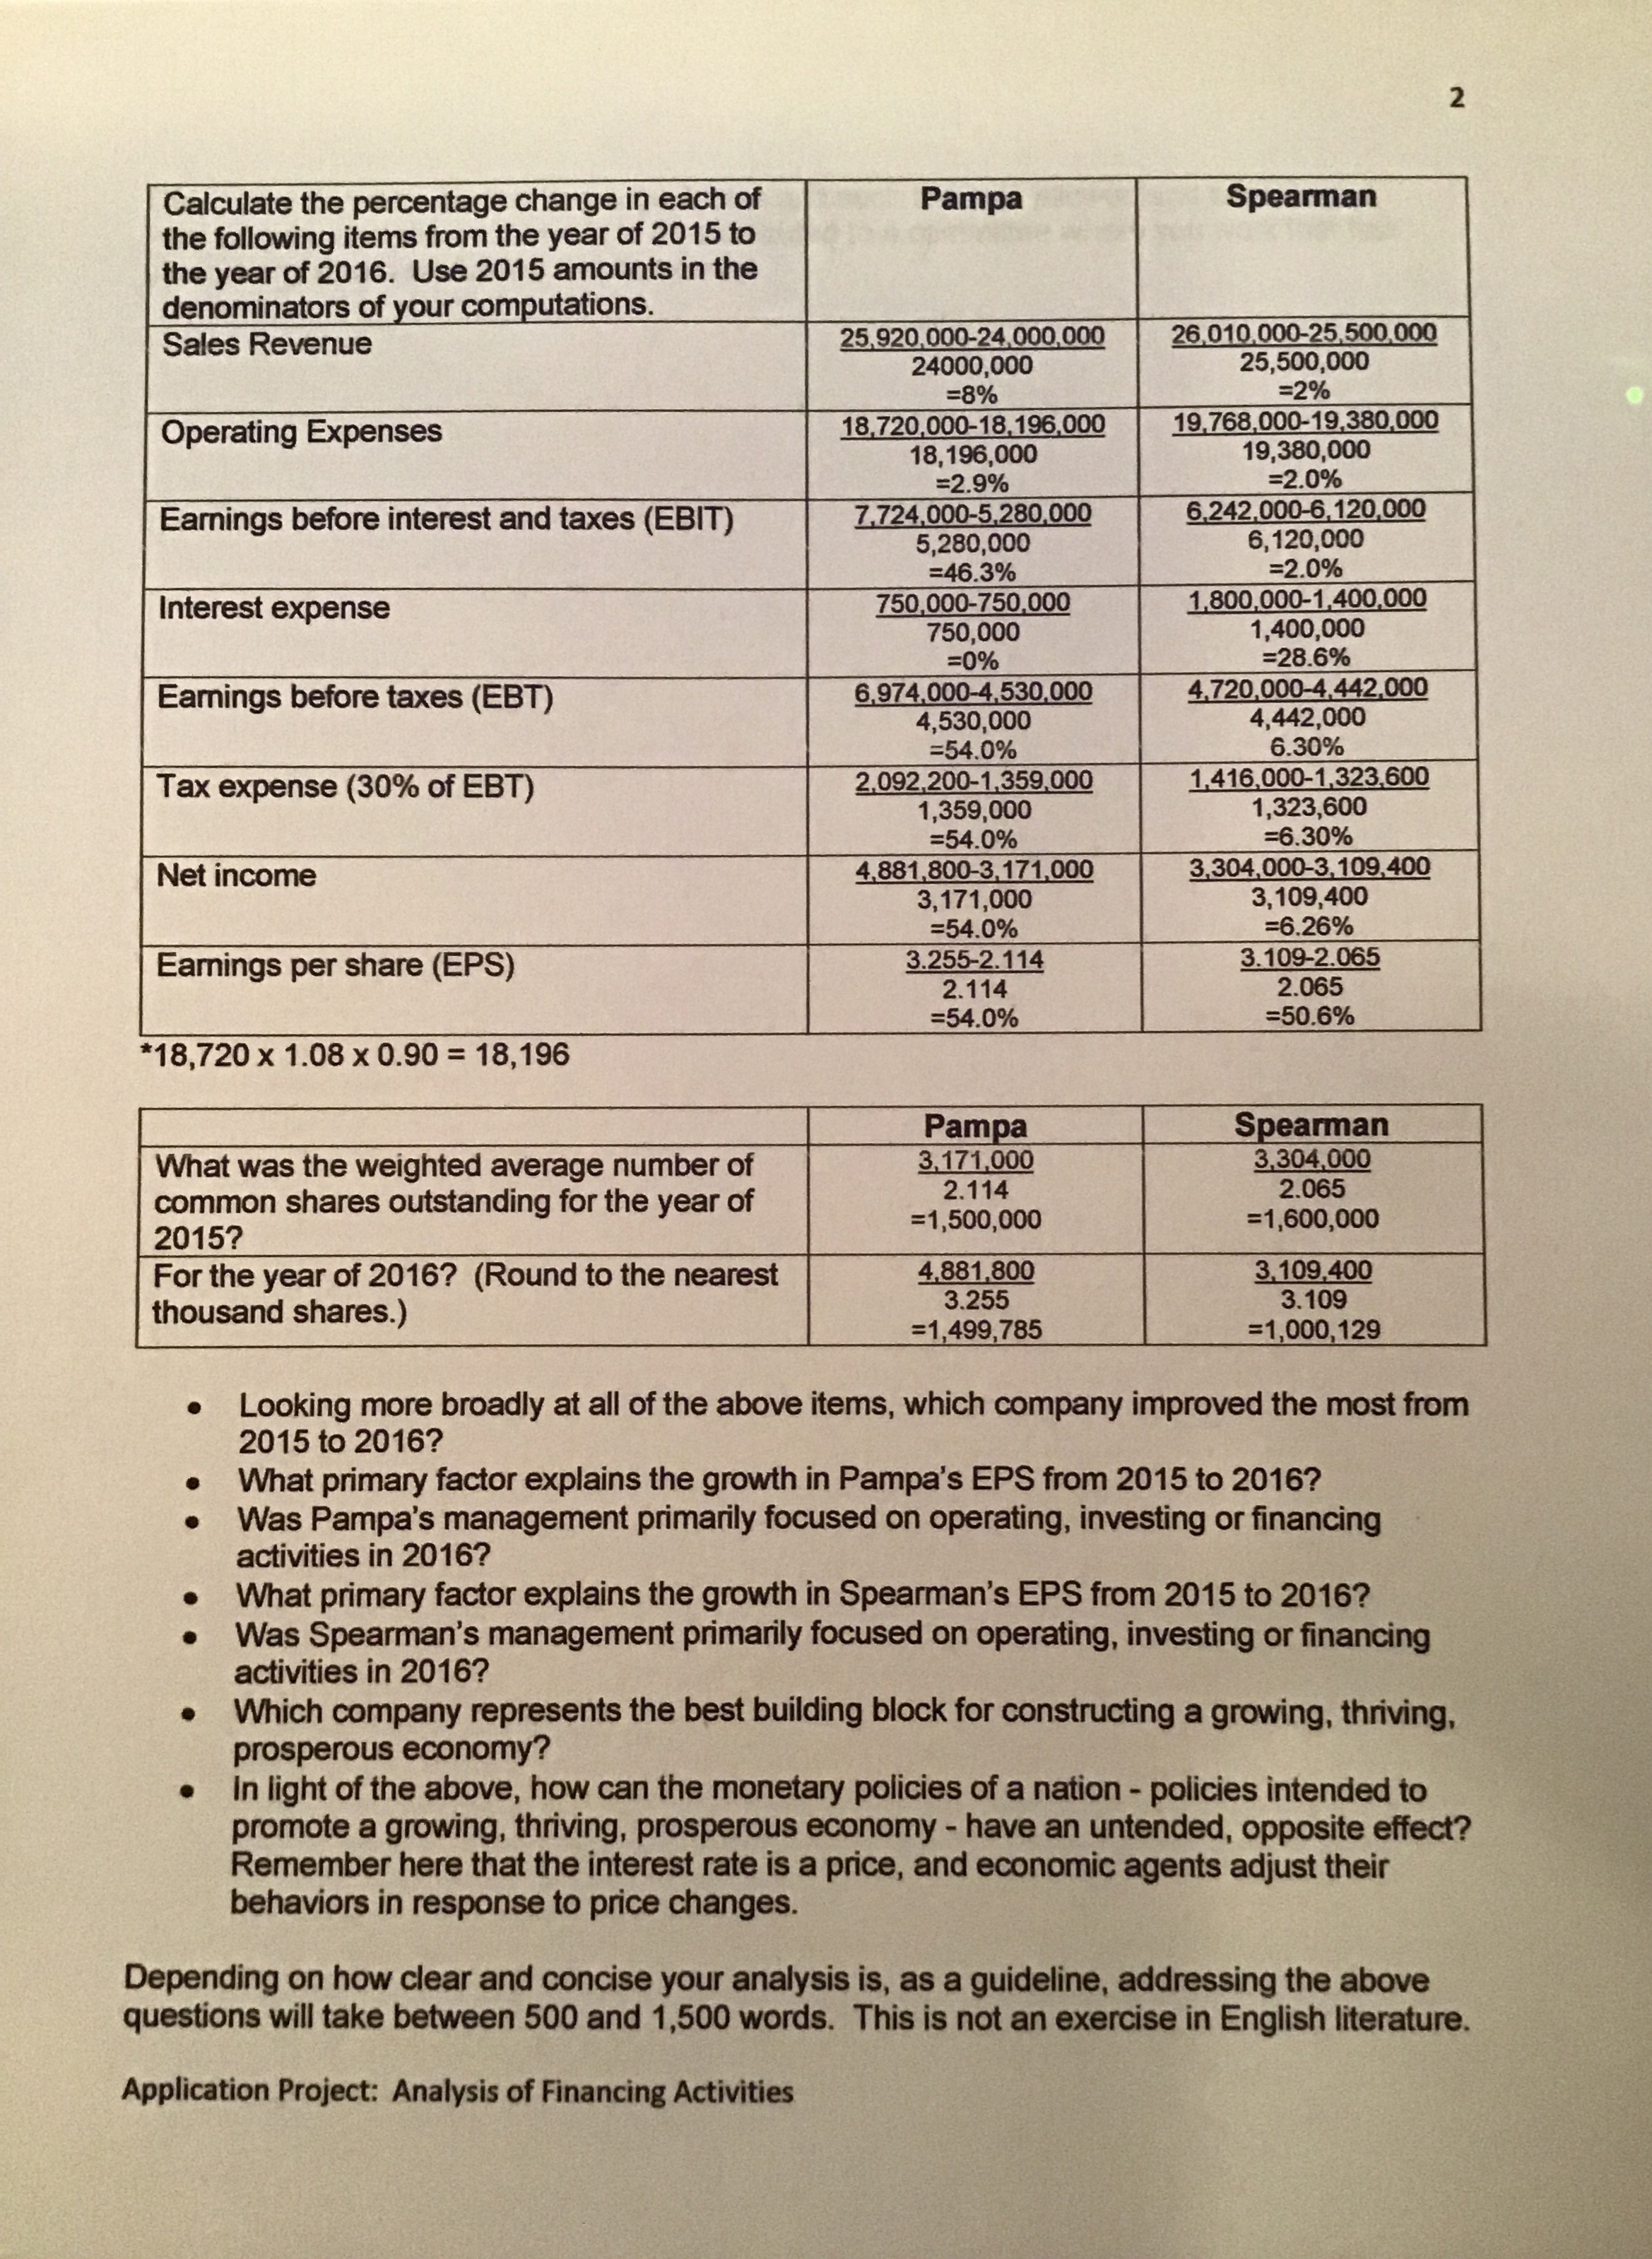
Pampa Agriculture Supply Selected Comparative Financial Statement Information Pampa Agriculture Supply has one serious local competitor: Spearman Distributors, Inc. Earnings per share (EPS) has consistently increased for both organizations. The management of Pampa is uncertain, however, if the underlying factors driving the increases in EPS are the same across both organizations. Thus, they are interested in financial analysis that goes beyond the surface level. In that regard the following information has been gathered for both Pampa and Spearman: For the Year Ended December 31, 2015 Pampa Spearman Sales Revenue $24,000,000 $25,500,000 Operating Expenses 18,720,000 19,380,000 Earnings before interest and taxes (EBIT) 5,280,000 6, 120,000 Interest expense 750,000 1,400,000 Earnings before taxes (EBT) 4,530,000 4,720,000 Tax expense (30% of EBT) 1,359,000 1,416,000 Net income $3, 171,000 $3,304,000 Earnings per share (EPS) $2.114 $2.065 For the Year Ended December 31, 2016 Pampa Spearman Sales Revenue $25,920,000 $26,010,000 Operating Expenses 18, 196,000 19,768,000 Earnings before interest and taxes (EBIT) 7,724,000 6,242,000 Interest expense 750,000 1,800,000 Earnings before taxes (EBT) 6,974,000 4,442,000 Tax expense (30% of EBT) 2,092,200 1,332,600 Net income $4,881,800 3,109,400 Earnings per share (EPS) $3.255 $3.109 Pampa Spearman By how much did EPS increase from the year 3.255-2.114/2.114 of 2015 to the year of 2016? Use EPS from 3.109-2.065/2.065 =54.0% 2015 as the denominator in your =50.6% computation. Focusing exclusively on EPS, which company improved the most from 2015 to 2016? What are the dangers of focusing on a single, or several, summary measures when evaluating a company? Given your answer to the above question, why do you think a relative handful of summary measures continue to receive extensive attention? What does your answer to the above question reveal about management of companies, financial analysts, and the investing public? Application Project: Analysis of Financing ActivitiesN Calculate the percentage change in each of Pampa Spearman the following items from the year of 2015 to the year of 2016. Use 2015 amounts in the denominators of your computations Sales Revenue 25,920,000-24,000,000 26,010,000-25,500,000 24000,000 25,500,000 =8% =2% Operating Expenses 18,720,000-18,196,000 19,768,000-19,380,000 18, 196,000 19,380,000 =2.9% =2.0% Earnings before interest and taxes (EBIT) 7,724,000-5,280,000 6,242,000-6,120,000 5,280,000 6, 120,000 =46.3% =2.0% Interest expense 750,000-750,000 1,800,000-1,400,000 750,000 1,400,000 =0% =28.6% Earnings before taxes (EBT) 6,974,000-4,530,000 4,720,000-4,442,000 4,530,000 4,442,000 =54.0% 6.30% Tax expense (30% of EBT) 2,092,200-1,359,000 1,416,000-1,323,600 ,359,000 1,323,600 =54.0% =6.30% Net income 4,881,800-3,171,000 3,304,000-3,109,400 3,171,000 3, 109,400 =54.0% =6.26% Earnings per share (EPS) 3.255-2.114 3.109-2.065 2.114 2.065 54.0% =50.6% *18,720 x 1.08 x 0.90 = 18, 196 Pampa Spearman What was the weighted average number of 3,171,000 3,304,000 common shares outstanding for the year of 2.114 2.065 2015? =1,500,000 =1,600,000 For the year of 2016? (Round to the nearest 4,881,800 3,109,400 thousand shares.) 3.255 3.109 =1,499,785 =1,000, 129 Looking more broadly at all of the above items, which company improved the most from 2015 to 2016? . . What primary factor explains the growth in Pampa's EPS from 2015 to 2016? Was Pampa's management primarily focused on operating, investing or financing activities in 2016? What primary factor explains the growth in Spearman's EPS from 2015 to 2016? . Was Spearman's management primarily focused on operating, investing or financing activities in 2016? Which company represents the best building block for constructing a growing, thriving, prosperous economy? In light of the above, how can the monetary policies of a nation - policies intended to promote a growing, thriving, prosperous economy - have an untended, opposite effect? Remember here that the interest rate is a price, and economic agents adjust their behaviors in response to price changes. Depending on how clear and concise your analysis is, as a guideline, addressing the above questions will take between 500 and 1,500 words. This is not an exercise in English literature. Application Project: Analysis of Financing Activities
Step by Step Solution
There are 3 Steps involved in it

Get step-by-step solutions from verified subject matter experts