

Question: NVP - Investment Analysis Template: Student's Work: Hello, I need help putting my work in blue into the above spreadsheet labeled NPV - Investment Analysis.
 NVP - Investment Analysis Template:
Student's Work:
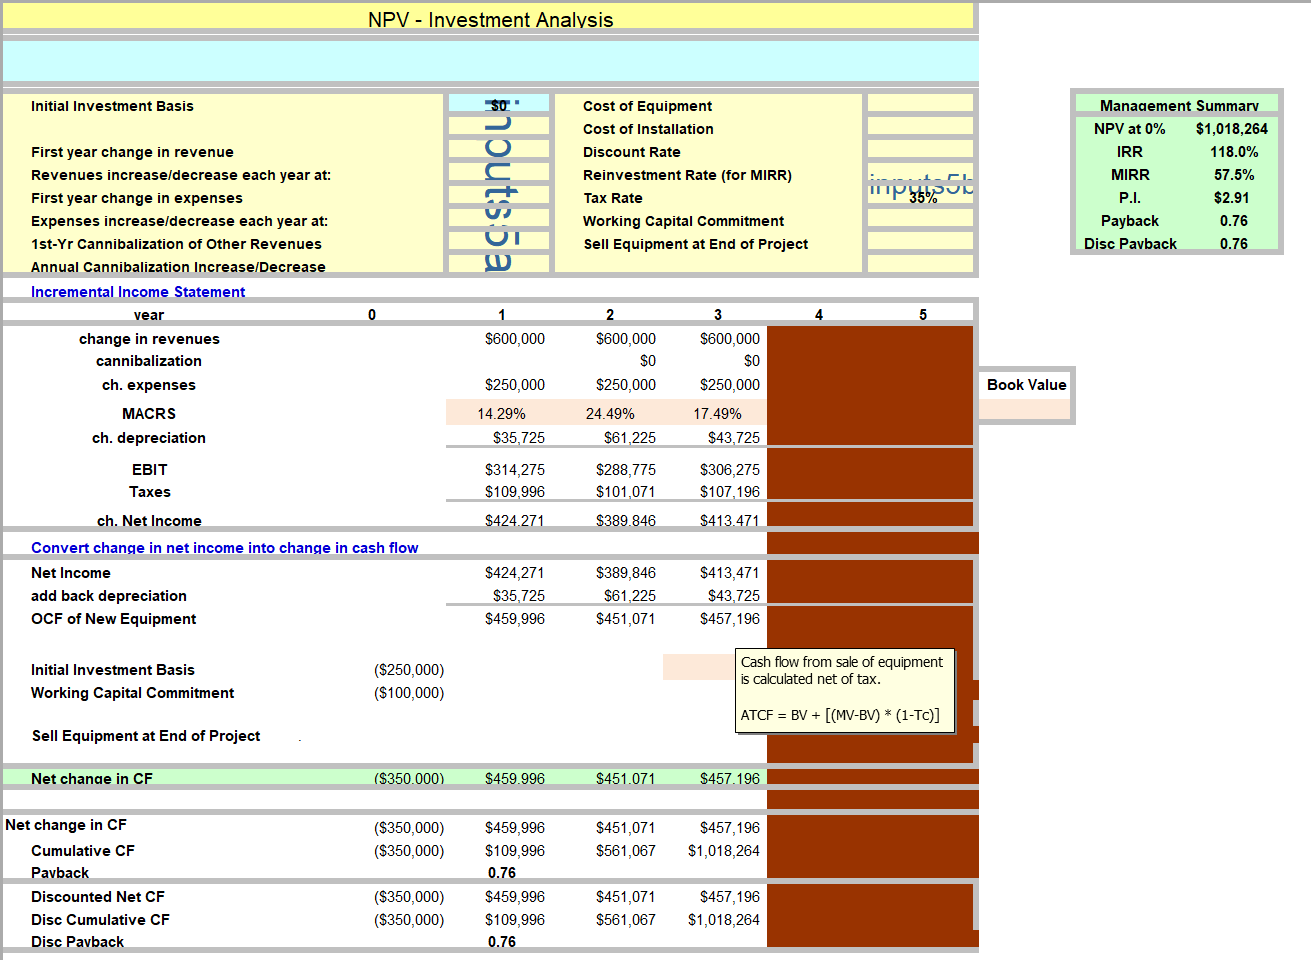
Hello, I need help putting my work in blue into the above spreadsheet labeled "NPV - Investment Analysis." I cannot seem to get the yearly Cash Flow numbers to match up. Thank you!
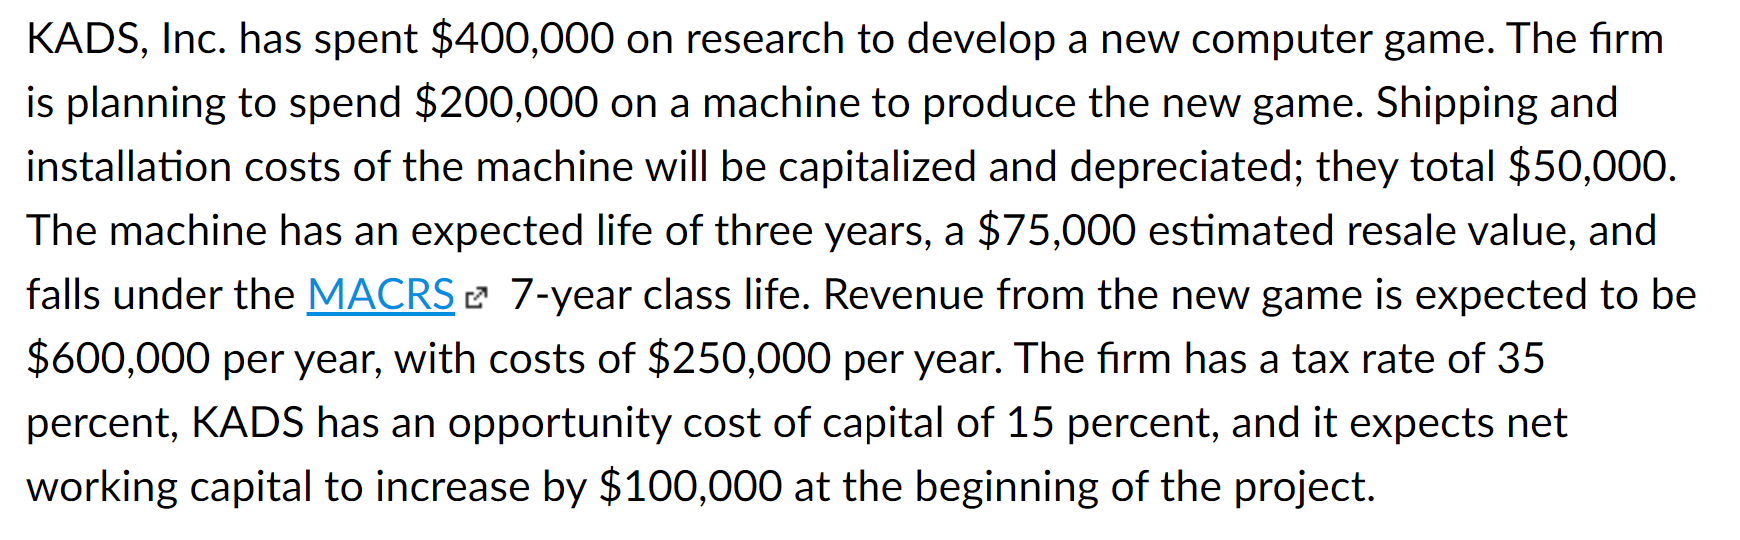
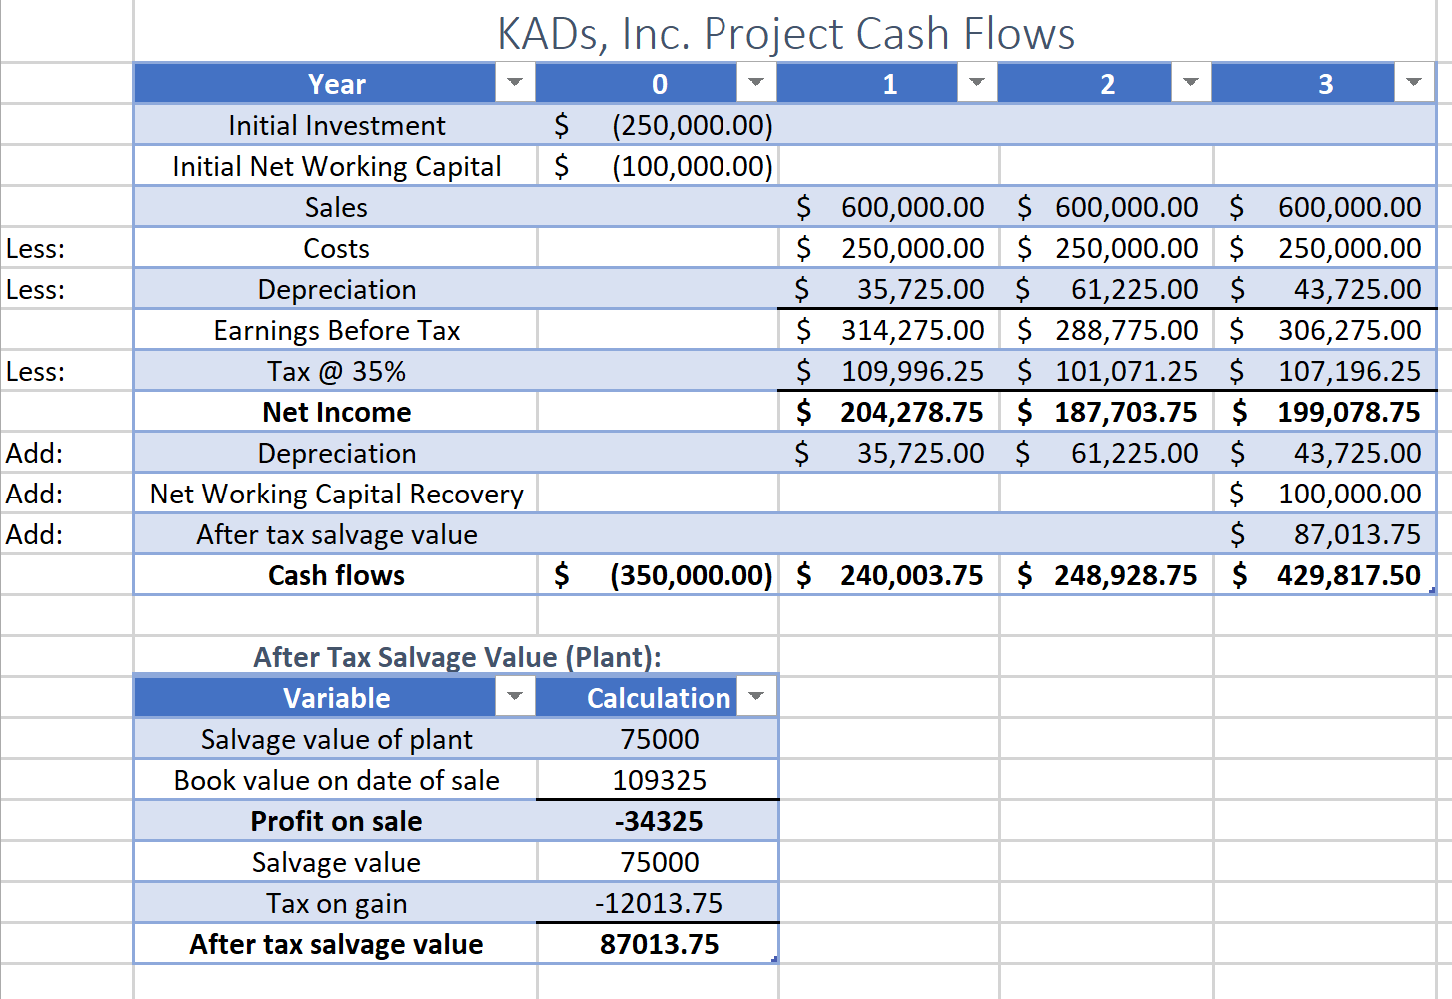
KADS, Inc. has spent $400,000 on research to develop a new computer game. The firm is planning to spend $200,000 on a machine to produce the new game. Shipping and installation costs of the machine will be capitalized and depreciated; they total $50,000. The machine has an expected life of three years, a $75,000 estimated resale value, and falls under the MACRS 7-year class life. Revenue from the new game is expected to be $600,000 per year, with costs of $250,000 per year. The firm has a tax rate of 35 percent, KADS has an opportunity cost of capital of 15 percent, and it expects net working capital to increase by $100,000 at the beginning of the project. NPV - Investment Analysis Initial Investment Basis Cost of Equipment Cost of Installation Discount Rate Reinvestment Rate (for MIRR) Tax Rate Working Capital Commitment Sell Equipment at End of Project II butsa Management Summary NPV at 0% $1,018,264 IRR 118.0% MIRR 57.5% P.I. $2.91 Payback 0.76 Disc Payback 0.76 357 First year change in revenue Revenues increase/decrease each year at: First year change in expenses Expenses increase/decrease each year at: 1st-Yr Cannibalization of Other Revenues Annual Cannibalization Increase/Decrease Incremental Income Statement vear change in revenues cannibalization ch. expenses MACRS ch. depreciation 0 4 5 1 $600,000 2 $600,000 $0 $250,000 $600,000 $0 $250,000 17.49% $43,725 $250,000 14.29% $35,725 Book Value 24.49% $61,225 EBIT $314,275 $109,996 $288,775 $101.071 $306,275 $107, 196 Taxes ch. Net Income $424.271 $389.846 $413.471 Convert change in net income into change in cash flow Net Income add back depreciation OCF of New Equipment $424,271 $35,725 $459,996 $389,846 $61,225 $451,071 $413,471 $43,725 $457,196 Initial Investment Basis Working Capital Commitment ($250,000) ($100,000) Cash flow from sale of equipment is calculated net of tax. ATCF = BV + [(MV-BV) * (1-TC)] Sell Equipment at End of Project Net change in CF ($350.000) $459.996 $451.071 $457.196 ($350,000) ($350,000) $451,071 $561,067 $457,196 $1,018,264 Net change in CF Cumulative CF Pavback Discounted Net CF Disc Cumulative CF Disc Payback $459,996 $109,996 0.76 $459,996 $109,996 0.76 ($350,000) ($350,000) $451,071 $561,067 $457,196 $1,018,264 Less: Less: KADs, Inc. Project Cash Flows Year 0 1 2 3 Initial Investment $ (250,000.00) Initial Net Working Capital $ (100,000.00) Sales $ 600,000.00 $ 600,000.00 $ 600,000.00 Costs $ 250,000.00 $ 250,000.00 $ 250,000.00 Depreciation $ 35,725.00 $ 61,225.00 $ 43,725.00 Earnings Before Tax $ 314,275.00 $ 288,775.00 $ 306,275.00 Tax @ 35% $ 109,996.25 $ 101,071.25 $ 107,196.25 Net Income $ 204,278.75 $ 187,703.75 $ 199,078.75 Depreciation $ 35,725.00 $ 61,225.00 $ 43,725.00 Net Working Capital Recovery $ 100,000.00 After tax salvage value $ 87,013.75 Cash flows $ (350,000.00) $ 240,003.75 $ 248,928.75 $ 429,817.50 Less: Add: Add: Add: After Tax Salvage Value (Plant): Variable Calculation Salvage value of plant 75000 Book value on date of sale 109325 Profit on sale -34325 Salvage value 75000 Tax on gain -12013.75 After tax salvage value 87013.75
Step by Step Solution
There are 3 Steps involved in it

Get step-by-step solutions from verified subject matter experts