

Question: O Based on the following graph, identify which area represents total surplus from buyers and sellers when in equilibrium. (You can select more than one
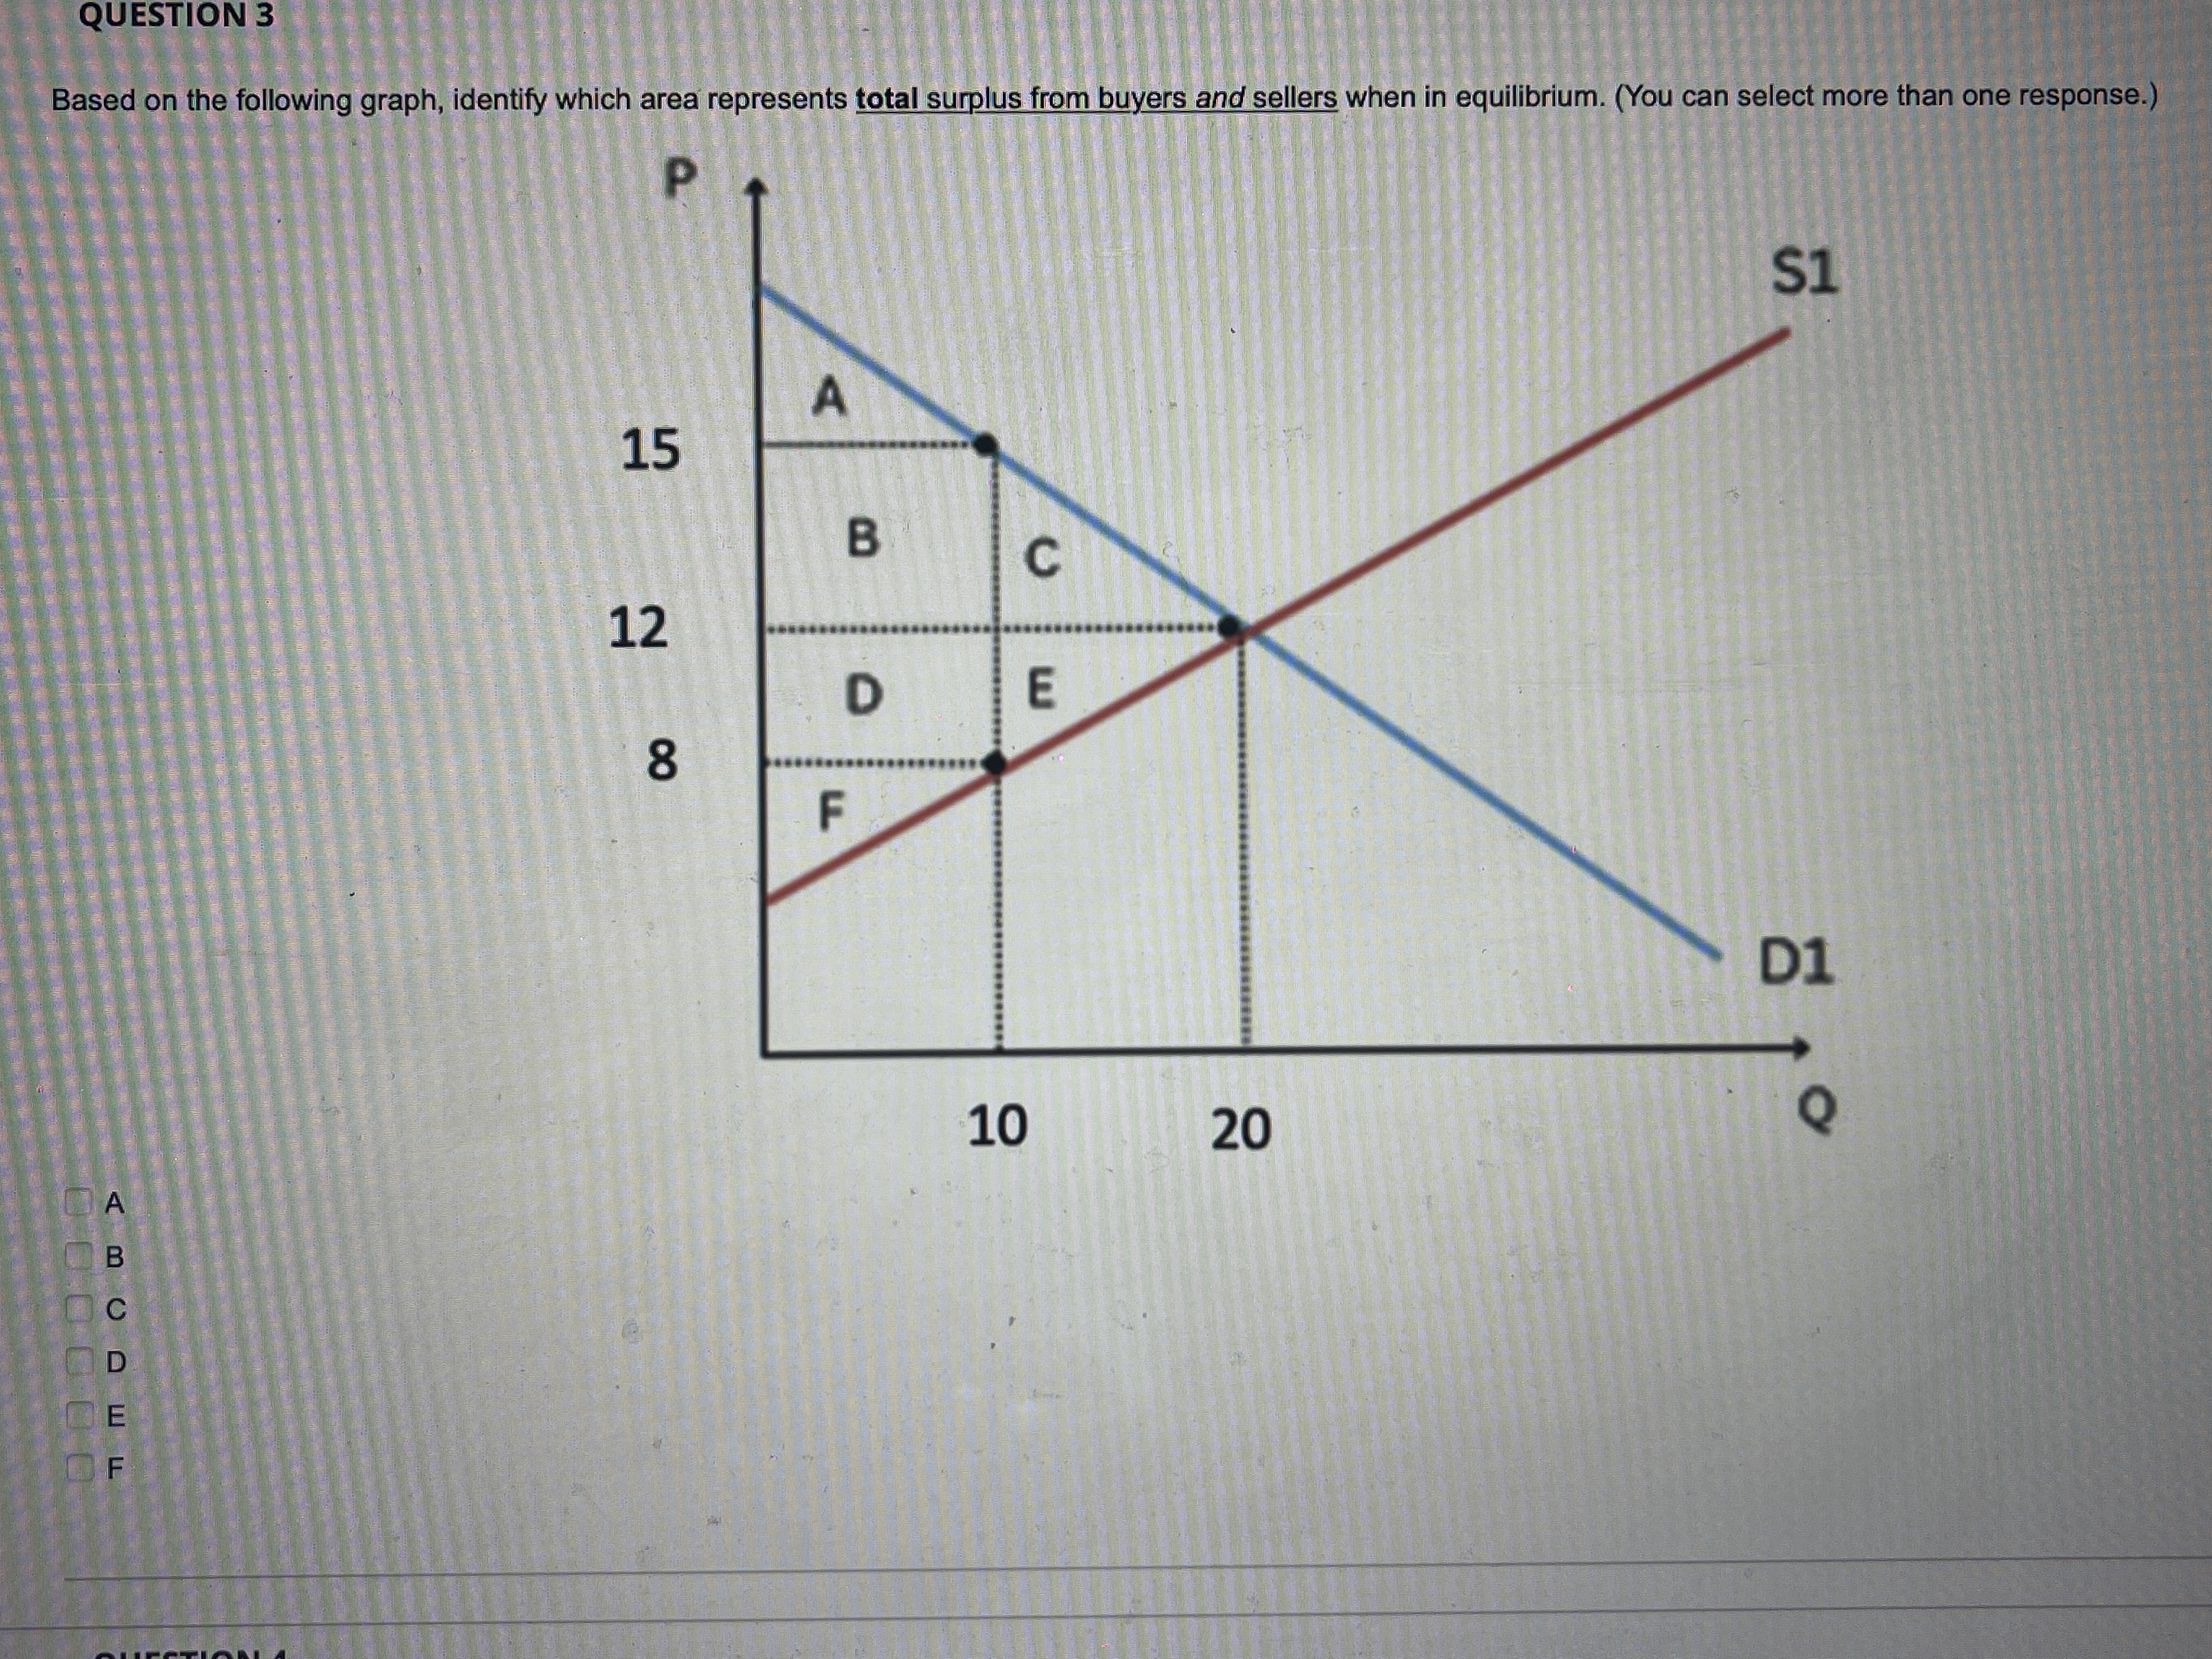

O Based on the following graph, identify which area represents total surplus from buyers and sellers when in equilibrium. (You can select more than one response.) w CO ......... LL UESTION 3 600 0 0
Step by Step Solution
There are 3 Steps involved in it
1 Expert Approved Answer
Step: 1 Unlock

Question Has Been Solved by an Expert!
Get step-by-step solutions from verified subject matter experts
Step: 2 Unlock
Step: 3 Unlock