

Question: O D 1 Evaluating Risk and Return 2 Bartman Industries Reynolds Inc. 4 Year Stock Price Dividend Stock Price Dividend 5 2020 $16.85 $1.14 $49.50
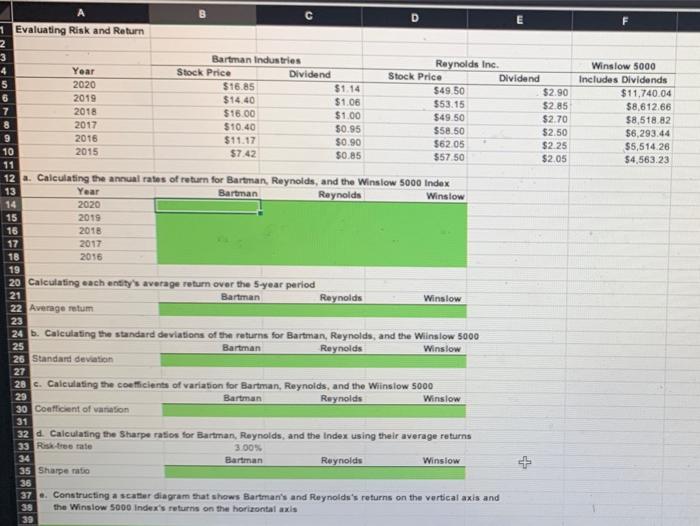
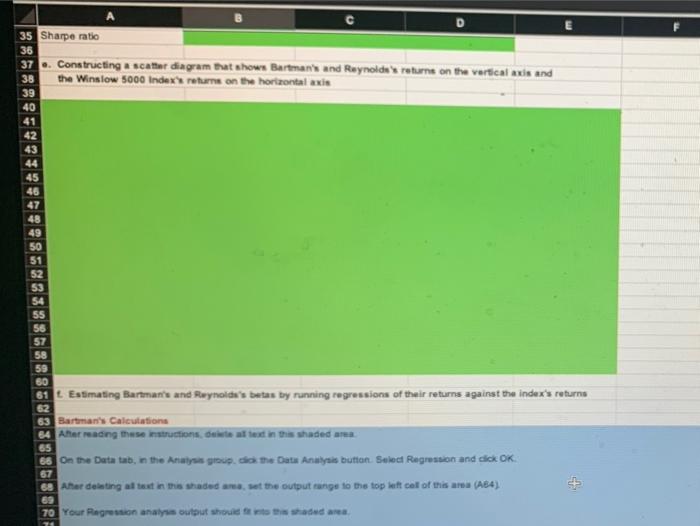
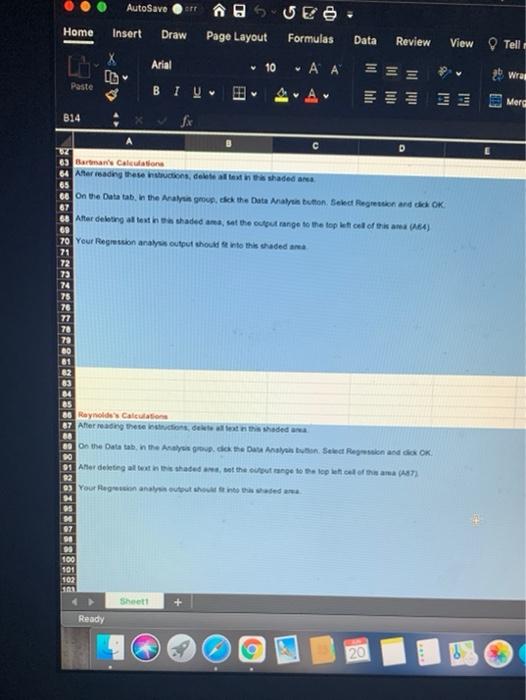
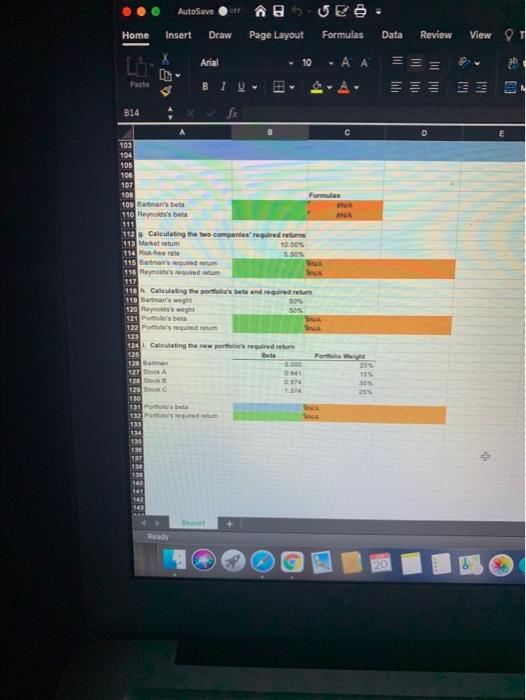
O D 1 Evaluating Risk and Return 2 Bartman Industries Reynolds Inc. 4 Year Stock Price Dividend Stock Price Dividend 5 2020 $16.85 $1.14 $49.50 $2.90 2019 $14.40 $1.06 $53.15 $2.85 2018 $16.00 $1.00 $49.50 $2.70 2017 $10.40 $0.95 $58.50 $2.50 9 2016 $11.17 $0.90 56205 $2.25 10 $7.42 $0.85 $5750 $2.05 11 12 a. Calculating the annual rates of return for Bartman, Reynolds, and the Winslow 5000 Index 13 Year Bartman Reynolds Winslow 2020 Winslow 5000 Includes Dividends $11.740.04 $8,612.66 $8.518.82 $6,293.44 $5,514.26 $4,563.23 2015 2019 15 16 17 2018 2017 2016 18 19 20 Calculating each antity's average return over the 5-year period Reynolds 22 Average ratum 21 Bartman Winslow 23 25 Bartman Winslow 27 24 b. Calculating the standard deviations of the returns for Bartman, Reynolds, and the Winslow 5000 Reynolds 26 Standard deviation 28. Calculating the coefficients of variation for Bartman, Reynolds, and the Winslow 5000 Reynolds Winslow 30 Coefficient of variation 32 a Calculating the Sharpe ratios for Bartman, Reynolds, and the Index using their average returns 29 Bartman 31 + 33 Ristrerate 3.00% 34 Bartman Raynolds Winslow 35 Sharpe ratio 36 37. Constructing a scather diagram that shows Bartman's and Reynolds's returns on the vertical axis and 38 the Winslow 5000 Index's returns on the horizontal axis 39 D E 35 Sharpe ratio 37. Constructing a scatter diagram that shows Bartman's and Reynolds returns on the vertical die and 36 38 the Winslow 5000 Index's returns on the horizontal axis 39 40 41 42 43 44 45 46 47 48 49 50 51 52 53 54 55 56 57 58 59 60 62 61 L Estimating Barman's and Rwynoldha's betes by running regressions of their returns against the index's returns 63 Bartman's Calculations 64 Aer reading these instructions de text in this shaded area 65 68 On the Data tab, in the Analysis group. so the Data Analysis button Select Regression and click OK 57 68 Ahar delasting all in this shadedreset the output range to the top left col of this area (A84) 69 70 Your Regression analys output should the area + AutoSave cer R@S DE Home Insert Draw Page Layout Formulas Data Review View Telli Le Arial 10 ESE Wrat Paste BIV A Mere 814 fix A 65 37 63 Barman's Calculation 64 Anar reading these con delete all text in shaded area es on the Date tab, in the Araba group ce the Data Analysbution Select Regression and OK ser dengan tentan a shadedama, at the output range to the top hat call of tikana ) 70 Your Regression analys output shout into this shaded 87 09 71 72 73 74 75 76 85 66 Reynolds Calculations 87 After reading these tons de text in the shaded Data tab, in the Analyse de Data Analyon ton Select Region and dix OK DO 01 Alter desting at with this shatud not the outrance to stop local of the ama (87) 92 Your Regression and how to weder 04 os 6 07 98 100 101 102 Sheet + Ready 20 AutoSave er ave: Home Insert Draw Page Layout Formulas Data Review View Arial - 10 - - 3 III lili I MI Paste SA B14 D 103 104 105 104 107 100 100 Batman's beta 110 Reynolds's beta Forms RE 112. Calculating the two companies' required 113 Matututum 16.00 150 Frete 5.50 115 Batman's rund um 116 Herred tum NA 110 Calculating the port and drum 199 Barat 30 120 yosh 121 Posts 122 Posts INA 123 124 Calculating the porter 125 Beta 12 banan 1800 127 SA 120 128 SC 130 130 Posts 132 PM 133 134 35 150 137 13 3 She Head 20
Step by Step Solution
There are 3 Steps involved in it

Get step-by-step solutions from verified subject matter experts