

Question: O Macmillan Learning Match the appropriate boxplot to each histogram Frequency Height distribution US adults of age 18 20 200 150 100 50 6 2000
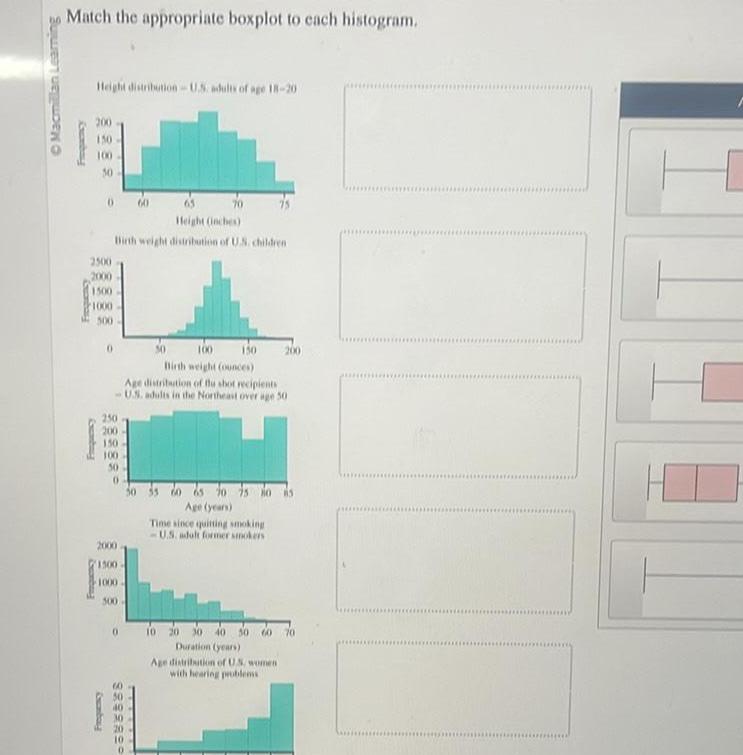

O Macmillan Learning Match the appropriate boxplot to each histogram Frequency Height distribution US adults of age 18 20 200 150 100 50 6 2000 1500 1000 500 70 Height inches Birth weight distribution of U S children 0 250 200 100 150 Birth weight ounces Age distribution of the shot recipients U S adults in the Northeast over age 50 150 100 50 0 2000 1500 1000 500 60 0 Frequency 0585388 50 200 50 55 60 65 to 75 o Age years Time since quitting smoking U S adult former smokers 10 20 30 40 50 60 70 Duration years Age distribution of US women with hearing problems
Step by Step Solution
There are 3 Steps involved in it
1 Expert Approved Answer
Step: 1 Unlock

Question Has Been Solved by an Expert!
Get step-by-step solutions from verified subject matter experts
Step: 2 Unlock
Step: 3 Unlock