

According to the Chebushev's Theorem what is the minimum percentage of all possible daily demand values...
Fantastic news! We've Found the answer you've been seeking!
Question:
Transcribed Image Text:
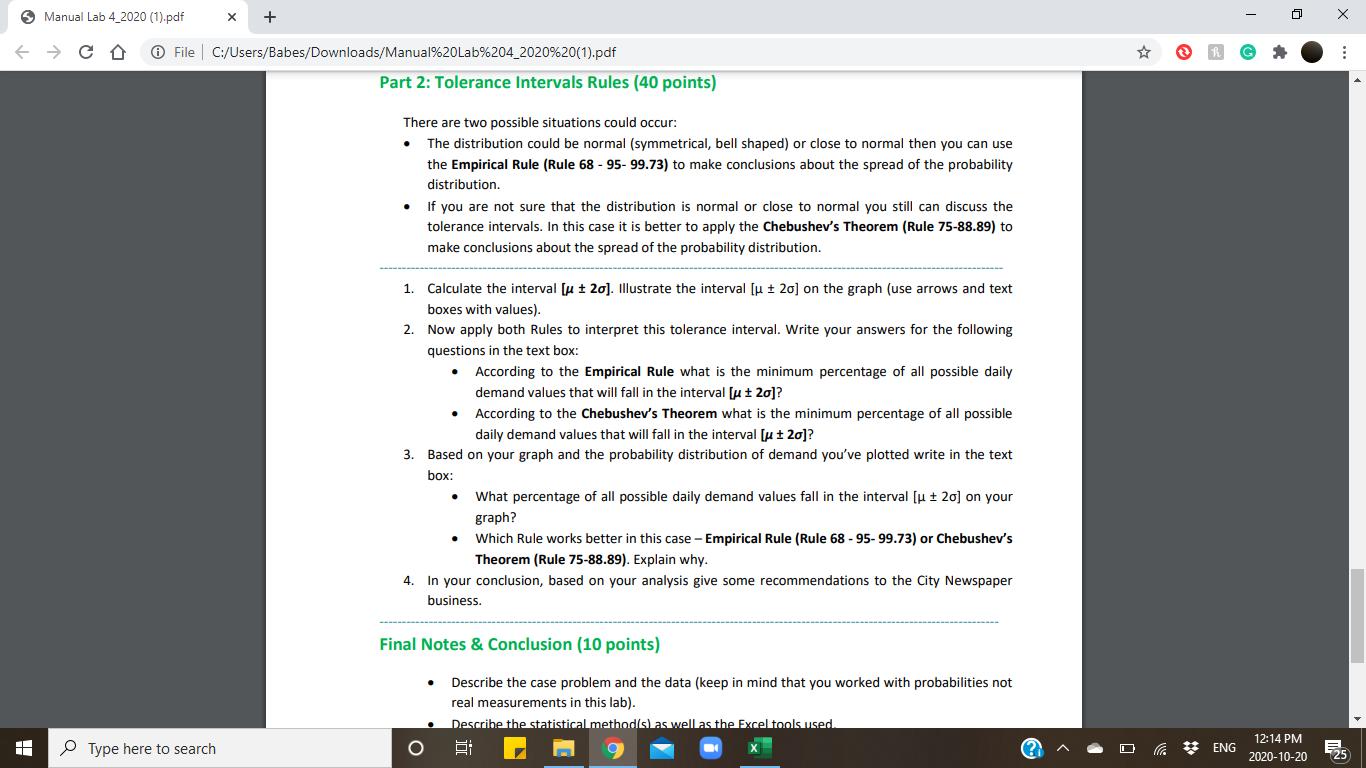
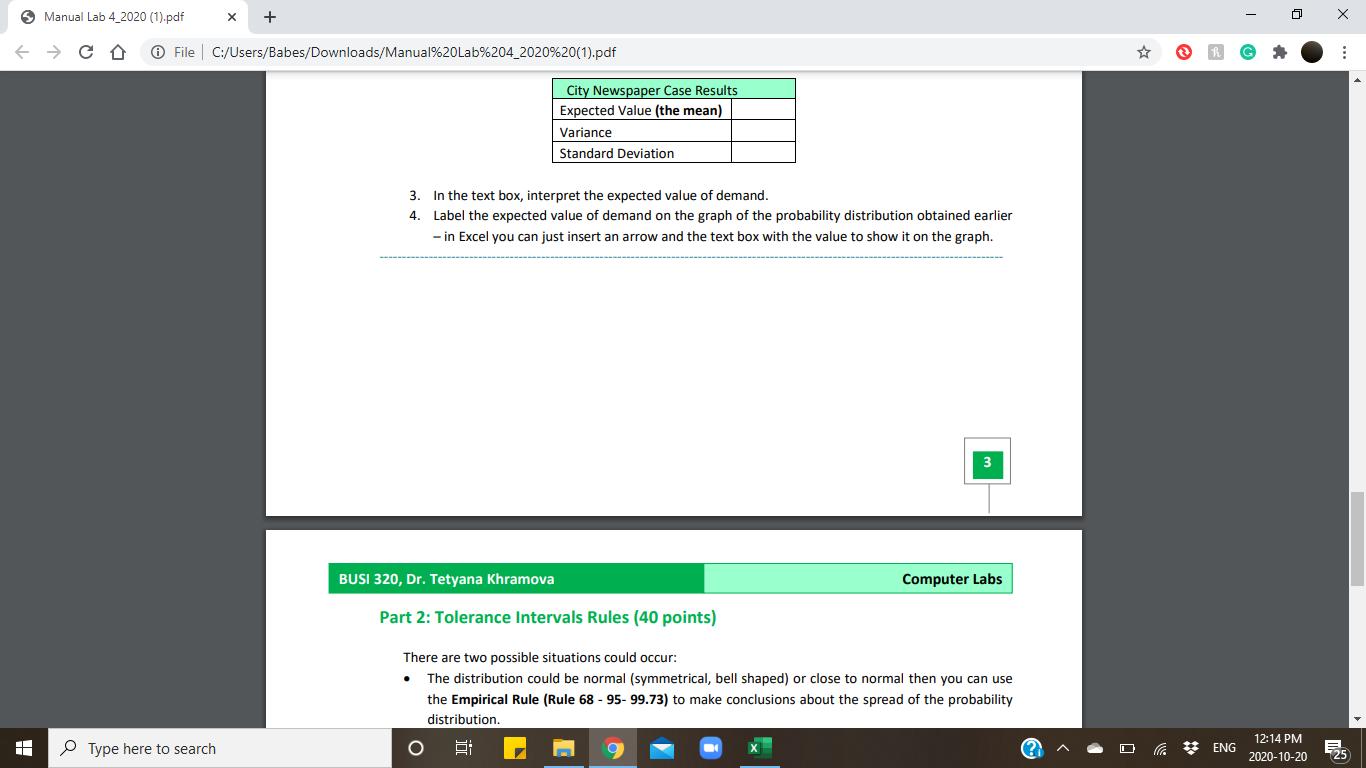
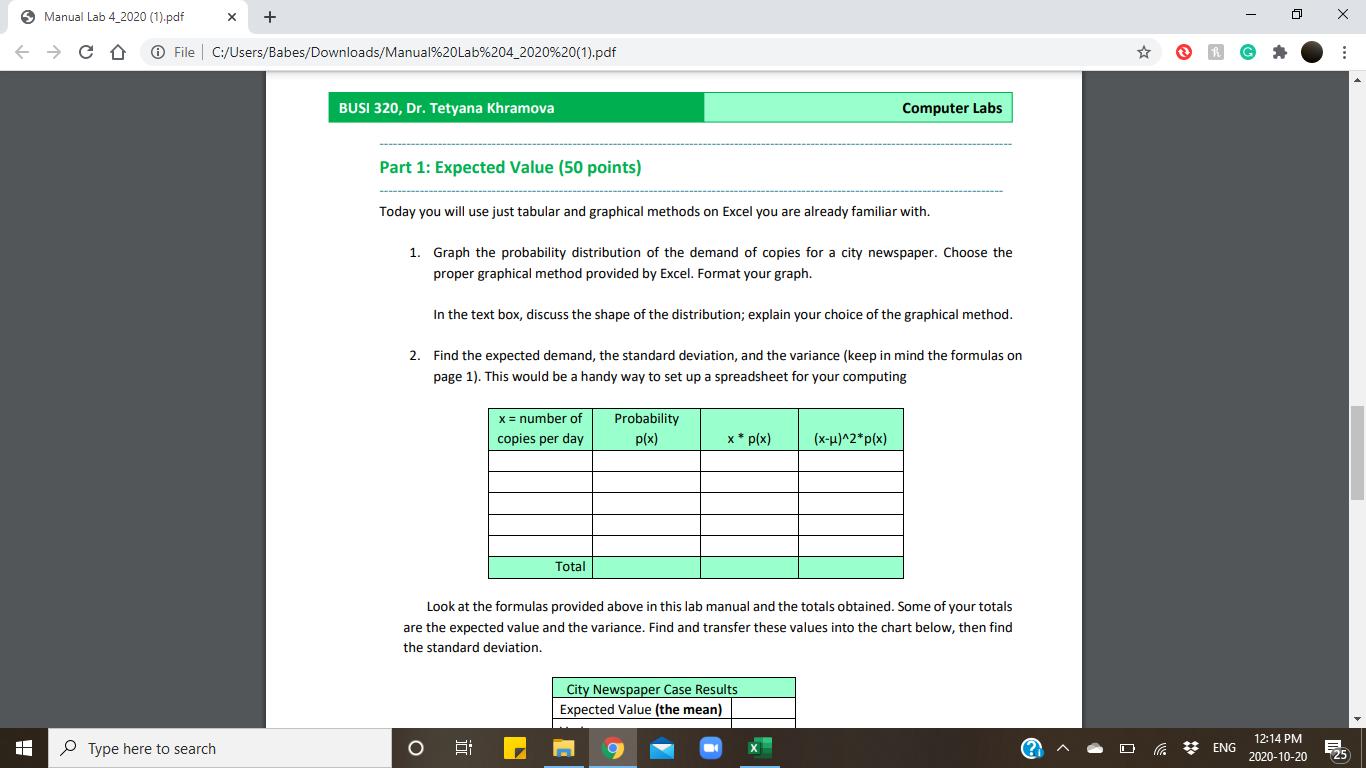
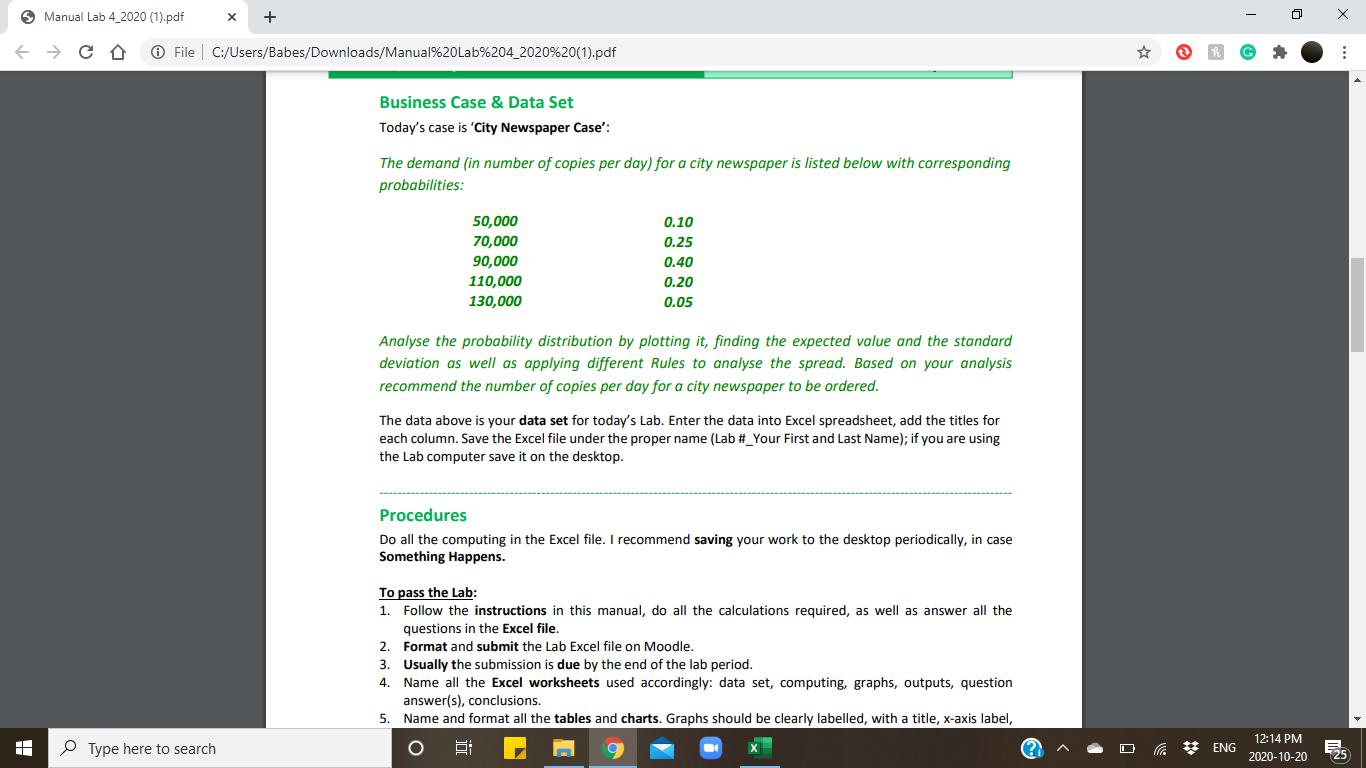
According to the Chebushev's Theorem what is the minimum percentage of all possible daily demand values that will fall in the interval [μ ± 20]? 3. Based on your graph and the probability distribution of demand you've plotted write in the text box: • What percentage of all possible daily demand values fall in the interval [μ ±20] on your graph? • Which Rule works better in this case - Empirical Rule (Rule 68-95-99.73) or Chebushev's Theorem (Rule 75-88.89). Explain why. 4. In your conclusion, based on your analysis give some recommendations to the City Newspaper business. Final Notes & Conclusion (10 points) • Describe the case problem and the data (keep in mind that you worked with probabilities not real measurements in this lab). Describe the statistical method(s) as well as the Excel tools used. . • Describe your results obtained in Part 1 and Part 2. In a business conclusion: based on your analysis give some recommendations to the City Newspaper business; specifically, recommend the number of copies per day for a city newspaper to be ordered. . Max 100 points Important Note: missing the deadline will reduce your mark in 25 points; the minimum score to pass the lab is 60 out of 100 points. Manual Lab 4_2020 (1).pdf ← → CO + X + File C:/Users/Babes/Downloads/Manual%20Lab%204_2020%20(1).pdf Type here to search Part 2: Tolerance Intervals Rules (40 points) There are two possible situations could occur: The distribution could be normal (symmetrical, bell shaped) or close to normal then you can use the Empirical Rule (Rule 68 - 95-99.73) to make conclusions about the spread of the probability distribution. ● . If you are not sure that the distribution is normal or close to normal you still can discuss the tolerance intervals. In this case it is better to apply the Chebushev's Theorem (Rule 75-88.89) to make conclusions about the spread of the probability distribution. 1. Calculate the interval [μ ±20]. Illustrate the interval [µ ± 20] on the graph (use arrows and text boxes with values). 2. Now apply both Rules to interpret this tolerance interval. Write your answers for the following questions in the text box: According to the Empirical Rule what is the minimum percentage of all possible daily demand values that will fall in the interval [μ ± 20]? According to the Chebushev's Theorem what is the minimum percentage of all possible daily demand values that will fall in the interval [μ ± 20]? 3. Based on your graph and the probability distribution of demand you've plotted write in the text box: ● What percentage of all possible daily demand values fall in the interval [μ ± 20] on your graph? Which Rule works better in this case - Empirical Rule (Rule 68-95-99.73) or Chebushev's Theorem (Rule 75-88.89). Explain why. 4. In your conclusion, based on your analysis give some recommendations to the City Newspaper business. . . . Final Notes & Conclusion (10 points) Describe the case problem and the data (keep in mind that you worked with probabilities not real measurements in this lab). Describe the statistical method(s) as well as the Excel tools used. 6: #ENG 0 X 12:14 PM 2020-10-20 : (25 Manual Lab 4_2020 (1).pdf File ← → CO + X Type here to search + C:/Users/Babes/Downloads/Manual%20Lab%204_2020%20(1).pdf 3. 4. BUSI 320, Dr. Tetyana Khramova City Newspaper Case Results Expected Value (the mean) Variance Standard Deviation In the text box, interpret the expected value of demand. Label the expected value of demand on the graph of the probability distribution obtained earlier - in Excel you can just insert an arrow and the text box with the value to show it on the graph. Part 2: Tolerance Intervals Rules (40 points) ● 3 Computer Labs There are two possible situations could occur: The distribution could be normal (symmetrical, bell shaped) or close to normal then you can use the Empirical Rule (Rule 68 - 95-99.73) to make conclusions about the spread of the probability distribution. 발 #ENG 0 X 12:14 PM 2020-10-20 : (25 Manual Lab 4_2020 (1).pdf File ← → CO + X + C:/Users/Babes/Downloads/Manual%20Lab%204_2020%20(1).pdf Type here to search BUSI 320, Dr. Tetyana Khramova Part 1: Expected Value (50 points) Today you will use just tabular and graphical methods on Excel you are already familiar with. 1. Graph the probability distribution of the demand of copies for a city newspaper. Choose the proper graphical method provided by Excel. Format your graph. In the text box, discuss the shape of the distribution; explain your choice of the graphical method. 2. Find the expected demand, the standard deviation, and the variance (keep in mind the formulas on page 1). This would be a handy way to set up a spreadsheet for your computing O x = number of copies per day 6: Total Probability p(x) x* p(x) Look at the formulas provided above in this lab manual and the totals obtained. Some of your totals are the expected value and the variance. Find and transfer these values into the chart below, then find the standard deviation. City Newspaper Case Results Expected Value (the mean) 9 Computer Labs (x-μ)^2*p(x) ? #ENG 0 X 12:14 PM 2020-10-20 : (25 Manual Lab 4_2020 (1).pdf ← C + X + Ⓒ File | C:/Users/Babes/Downloads/Manual%20Lab%204_2020%20(1).pdf Type here to search Business Case & Data Set Today's case is 'City Newspaper Case': The demand (in number of copies per day) for a city newspaper is listed below with corresponding probabilities: 50,000 70,000 90,000 110,000 130,000 0.10 0.25 0.40 0.20 0.05 Analyse the probability distribution by plotting it, finding the expected value and the standard deviation as well as applying different Rules to analyse the spread. Based on your analysis recommend the number of copies per day for a city newspaper to be ordered. The data above is your data set for today's Lab. Enter the data into Excel spreadsheet, add the titles for each column. Save the Excel file under the proper name (Lab #_Your First and Last Name); if you are using the Lab computer save it on the desktop. Procedures Do all the computing in the Excel file. I recommend saving your work to the desktop periodically, in case Something Happens. To pass the Lab: 1. Follow the instructions in this manual, do all the calculations required, as well as answer all the questions in the Excel file. 2. Format and submit the Lab Excel file on Moodle. 3. Usually the submission is due by the end of the lab period. 4. Name all the Excel worksheets used accordingly: data set, computing, graphs, outputs, question answer(s), conclusions. 5. Name and format all the tables and charts. Graphs should be clearly labelled, with a title, x-axis label, 9 Hi #ENG 0 X 12:14 PM 2020-10-20 : (25 According to the Chebushev's Theorem what is the minimum percentage of all possible daily demand values that will fall in the interval [μ ± 20]? 3. Based on your graph and the probability distribution of demand you've plotted write in the text box: • What percentage of all possible daily demand values fall in the interval [μ ±20] on your graph? • Which Rule works better in this case - Empirical Rule (Rule 68-95-99.73) or Chebushev's Theorem (Rule 75-88.89). Explain why. 4. In your conclusion, based on your analysis give some recommendations to the City Newspaper business. Final Notes & Conclusion (10 points) • Describe the case problem and the data (keep in mind that you worked with probabilities not real measurements in this lab). Describe the statistical method(s) as well as the Excel tools used. . • Describe your results obtained in Part 1 and Part 2. In a business conclusion: based on your analysis give some recommendations to the City Newspaper business; specifically, recommend the number of copies per day for a city newspaper to be ordered. . Max 100 points Important Note: missing the deadline will reduce your mark in 25 points; the minimum score to pass the lab is 60 out of 100 points. Manual Lab 4_2020 (1).pdf ← → CO + X + File C:/Users/Babes/Downloads/Manual%20Lab%204_2020%20(1).pdf Type here to search Part 2: Tolerance Intervals Rules (40 points) There are two possible situations could occur: The distribution could be normal (symmetrical, bell shaped) or close to normal then you can use the Empirical Rule (Rule 68 - 95-99.73) to make conclusions about the spread of the probability distribution. ● . If you are not sure that the distribution is normal or close to normal you still can discuss the tolerance intervals. In this case it is better to apply the Chebushev's Theorem (Rule 75-88.89) to make conclusions about the spread of the probability distribution. 1. Calculate the interval [μ ±20]. Illustrate the interval [µ ± 20] on the graph (use arrows and text boxes with values). 2. Now apply both Rules to interpret this tolerance interval. Write your answers for the following questions in the text box: According to the Empirical Rule what is the minimum percentage of all possible daily demand values that will fall in the interval [μ ± 20]? According to the Chebushev's Theorem what is the minimum percentage of all possible daily demand values that will fall in the interval [μ ± 20]? 3. Based on your graph and the probability distribution of demand you've plotted write in the text box: ● What percentage of all possible daily demand values fall in the interval [μ ± 20] on your graph? Which Rule works better in this case - Empirical Rule (Rule 68-95-99.73) or Chebushev's Theorem (Rule 75-88.89). Explain why. 4. In your conclusion, based on your analysis give some recommendations to the City Newspaper business. . . . Final Notes & Conclusion (10 points) Describe the case problem and the data (keep in mind that you worked with probabilities not real measurements in this lab). Describe the statistical method(s) as well as the Excel tools used. 6: #ENG 0 X 12:14 PM 2020-10-20 : (25 Manual Lab 4_2020 (1).pdf File ← → CO + X Type here to search + C:/Users/Babes/Downloads/Manual%20Lab%204_2020%20(1).pdf 3. 4. BUSI 320, Dr. Tetyana Khramova City Newspaper Case Results Expected Value (the mean) Variance Standard Deviation In the text box, interpret the expected value of demand. Label the expected value of demand on the graph of the probability distribution obtained earlier - in Excel you can just insert an arrow and the text box with the value to show it on the graph. Part 2: Tolerance Intervals Rules (40 points) ● 3 Computer Labs There are two possible situations could occur: The distribution could be normal (symmetrical, bell shaped) or close to normal then you can use the Empirical Rule (Rule 68 - 95-99.73) to make conclusions about the spread of the probability distribution. 발 #ENG 0 X 12:14 PM 2020-10-20 : (25 Manual Lab 4_2020 (1).pdf File ← → CO + X + C:/Users/Babes/Downloads/Manual%20Lab%204_2020%20(1).pdf Type here to search BUSI 320, Dr. Tetyana Khramova Part 1: Expected Value (50 points) Today you will use just tabular and graphical methods on Excel you are already familiar with. 1. Graph the probability distribution of the demand of copies for a city newspaper. Choose the proper graphical method provided by Excel. Format your graph. In the text box, discuss the shape of the distribution; explain your choice of the graphical method. 2. Find the expected demand, the standard deviation, and the variance (keep in mind the formulas on page 1). This would be a handy way to set up a spreadsheet for your computing O x = number of copies per day 6: Total Probability p(x) x* p(x) Look at the formulas provided above in this lab manual and the totals obtained. Some of your totals are the expected value and the variance. Find and transfer these values into the chart below, then find the standard deviation. City Newspaper Case Results Expected Value (the mean) 9 Computer Labs (x-μ)^2*p(x) ? #ENG 0 X 12:14 PM 2020-10-20 : (25 Manual Lab 4_2020 (1).pdf ← C + X + Ⓒ File | C:/Users/Babes/Downloads/Manual%20Lab%204_2020%20(1).pdf Type here to search Business Case & Data Set Today's case is 'City Newspaper Case': The demand (in number of copies per day) for a city newspaper is listed below with corresponding probabilities: 50,000 70,000 90,000 110,000 130,000 0.10 0.25 0.40 0.20 0.05 Analyse the probability distribution by plotting it, finding the expected value and the standard deviation as well as applying different Rules to analyse the spread. Based on your analysis recommend the number of copies per day for a city newspaper to be ordered. The data above is your data set for today's Lab. Enter the data into Excel spreadsheet, add the titles for each column. Save the Excel file under the proper name (Lab #_Your First and Last Name); if you are using the Lab computer save it on the desktop. Procedures Do all the computing in the Excel file. I recommend saving your work to the desktop periodically, in case Something Happens. To pass the Lab: 1. Follow the instructions in this manual, do all the calculations required, as well as answer all the questions in the Excel file. 2. Format and submit the Lab Excel file on Moodle. 3. Usually the submission is due by the end of the lab period. 4. Name all the Excel worksheets used accordingly: data set, computing, graphs, outputs, question answer(s), conclusions. 5. Name and format all the tables and charts. Graphs should be clearly labelled, with a title, x-axis label, 9 Hi #ENG 0 X 12:14 PM 2020-10-20 : (25
Expert Answer:
Answer rating: 100% (QA)
ANSWER Chebyshevs theorem estimates the minimum proportion of data within a certain number of standa... View the full answer

Related Book For 

Statistics for Business and Economics
ISBN: 978-0132930192
8th edition
Authors: Paul Newbold, William Carlson, Betty Thorne
Posted Date:
Students also viewed these accounting questions
-
What is the minimum percentage of overlapping so that the FFT process is called real time process?
-
The Empirical Rule applies rough approximations to probabilities for any unimodal, symmetric distribution. But for the Normal distribution we can be more precise. Use the figure and the fact that the...
-
Some data sets contain outliers, observations that fall well outside the overall pattern of the data. (We discuss outliers in more detail in Section 3.3.) Suppose, for instance, that you are...
-
Law Management Services began business on January 1, 2012, with a capital investment of $120,000. The company manages condominiums for owners (Service Revenue) and rents space in its own office...
-
On a multiple choice exam, a student decides to test his luck. His exam has 20 questions, each of which has 5 answer choices. The student decides to roll a die on each question and use the result on...
-
Queuing theory deals with the trade-off between the cost of providing good service and the hard to quantify cost of customer waiting time. a. True b. False
-
Suppose that in the experiment described in Example 7, Chapter 12, it is desired to determine also whether there is an interaction between the detergents and the engines; that is, whether one...
-
Preparing a statement of cash flows. (Adapted from CPA examination.) The management of Warren Corporation, concerned over a decrease in cash, provides you with the comparative analysis of changes in...
-
To shake her attacker, Woody flies directly upwards at 2 1 . 0 km / h ( woodpeckers can fly slightly faster than this when flapping their wings, but this particular woodpecker is a little weighted...
-
Dawn is transporting 500 kg of Class 5.1 CAESIUM NITRATE. After skidding off the road to avoid a collision, she discovers about 10 kg of the flammable solid has been released. There were no road...
-
A firm pays a current dividend of $1, which is expected to grow at a rate of 9% indefinitely. If the current value of the firm's shares is $109, what is the required return applicable to the...
-
You currently have $63,000,000 in a stock portfolio with a beta of 1.20. Expecting stocks to do very poorly over the next three months, you decide to REDUCE your beta to 0.80. There exists a futures...
-
A real estate development company is planning to construct a stadium building. The estimated construction cost is $20 million. The owner is authorized to issue $23 million of bonds. The bonds will be...
-
In terms of HSAB which end of the SCN ion would you expect the following metals to coordinate? Explain your answer. a. Cr3+ b. Pt+ d. Ag e. Fe3+ C. Ru3+ Use HSAB theory to predict which of these two...
-
Canawacta Tioga is the CFO for Wyalusing Corporation, a multinational manufacturing company based in Canada. One year ago, Wyalusing issued fixed-rate coupon bonds in Canada. Tioga now expects...
-
How do medical billing and coding regulations affect reimbursement in a healthcare organization? After reviewing the steps in the revenue cycle, what are the various tasks that the different...
-
Jessica bought a new heavy truck for $35,000 to use 80% for her sole proprietorship. Total miles driven include 8,000 in 2019, 9,000 in 2020, and 8,500 in 2021. If Jessica uses the standard mileage...
-
d. The characteristic equation of a control system is given by s+2s+8s+12s+20s+16+16=0. Determine the number of the roots of the equation which lie on the imaginary axis of s-plane
-
A conference began at noon with two parallel sessions. The session on portfolio management was attended by 40% of the delegates, while the session on chartism was attended by 50%. The evening session...
-
Refer to Exercise 15.31. Having carried out the experiment to compare mean yields per acre of four varieties of corn and three brands of fertilizer, an agricultural researcher suggested that there...
-
At the beginning of the year, a stock market analyst produced a list of stocks to buy and another list of stocks to sell. For a random sample of 10 stocks from the buy list, percentage returns over...
-
Derive the differential equation governing the motion of the one degree-of-freedom system by applying the appropriate form(s) of Newton's laws to the appropriate free-body diagrams. Use the...
-
Determine the differential equations governing the motion of the system by using the equivalent systems method. Use the generalized coordinates shown in Figures P2.52. k FIGURE P 2.52 E x 2k www
-
Determine the differential equations governing the motion of the system by using the equivalent systems method. Use the generalized coordinates shown in Figures P2.53. 2r k ww T m FIGURE P 2.53

Study smarter with the SolutionInn App