

Question: Objective 2: Analyzing Secondary Data [12] 1) Using the data collected from statistics Canada below, you are to create two scatter plots on one graph
![Objective 2: Analyzing Secondary Data [12] 1) Using the data collected](https://s3.amazonaws.com/si.experts.images/answers/2024/06/667d8d61a2381_225667d8d617accd.jpg)
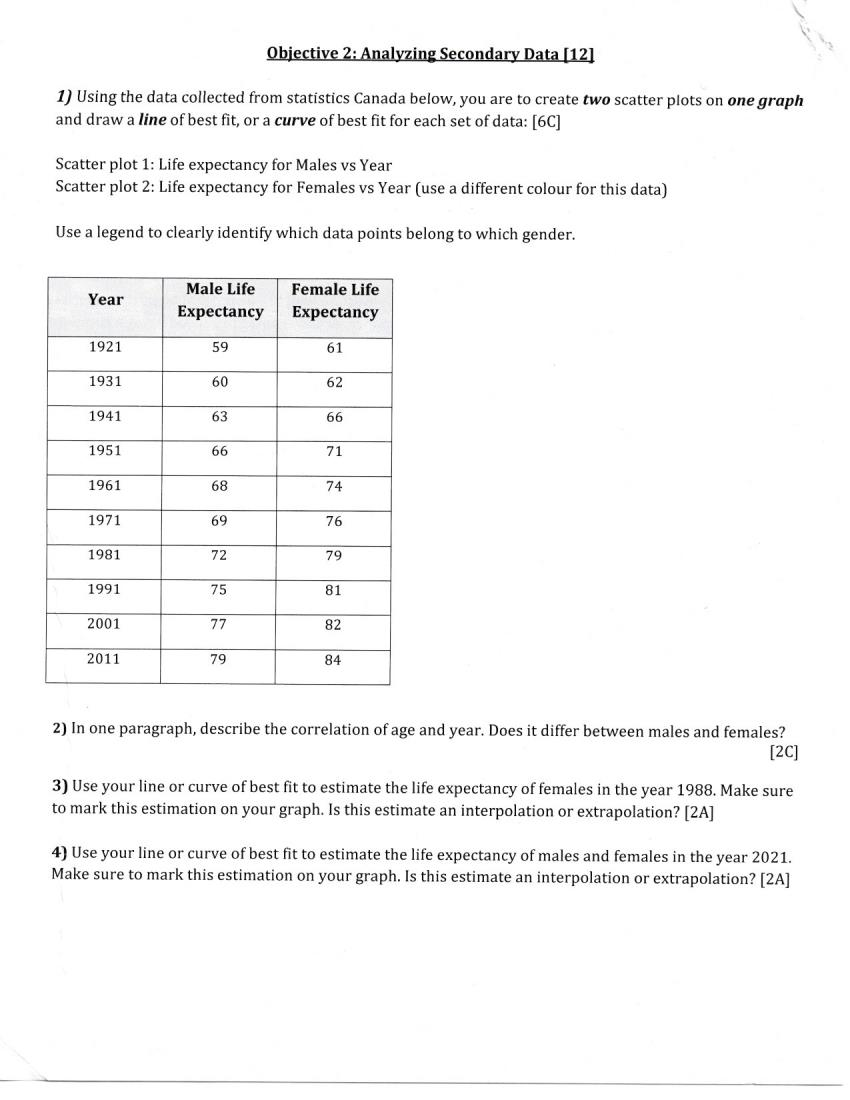
Objective 2: Analyzing Secondary Data [12] 1) Using the data collected from statistics Canada below, you are to create two scatter plots on one graph and draw a line of best fit, or a curve of best fit for each set of data: [6C] Scatter plot 1: Life expectancy for Males vs Year Scatter plot 2: Life expectancy for Females vs Year (use a different colour for this data) Use a legend to clearly identify which data points belong to which gender. Male Life Year Female Life Expectancy Expectancy 1921 59 61 1931 60 62 1941 63 66 1951 66 71 1961 68 74 1971 69 76 1981 72 79 1991 75 81 2001 77 82 2011 79 84 2) In one paragraph, describe the correlation of age and year. Does it differ between males and females? [2C] 3) Use your line or curve of best fit to estimate the life expectancy of females in the year 1988. Make sure to mark this estimation on your graph. Is this estimate an interpolation or extrapolation? [2A] 4) Use your line or curve of best fit to estimate the life expectancy of males and females in the year 2021. Make sure to mark this estimation on your graph. Is this estimate an interpolation or extrapolation? [2A]
Step by Step Solution
There are 3 Steps involved in it

Get step-by-step solutions from verified subject matter experts