

Question: teview the data you collected in Learning Activity 4.6: Data investigation. Part A: Consider the data for your 20 cities. Create three scatter plots: One
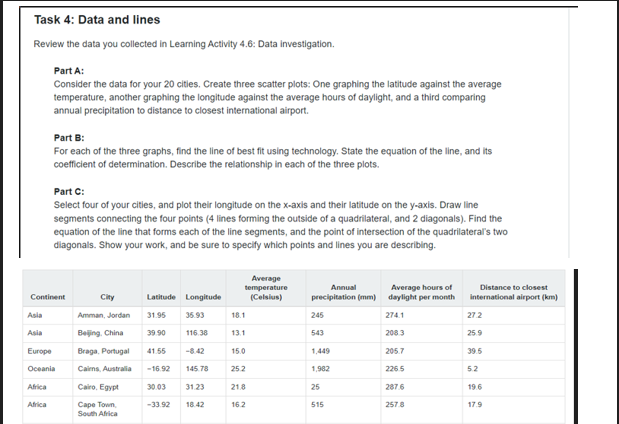
teview the data you collected in Learning Activity 4.6: Data investigation. Part A: Consider the data for your 20 cities. Create three scatter plots: One graphing the latitude against the average temperature, another graphing the longitude against the average hours of daylight, and a third comparing annual precipitation to distance to closest international airport. Part B: For each of the three graphs, find the line of best fit using technology. State the equation of the line, and lis coefficient of determination. Describe the relationship in each of the three plots. Part C: Select four of your cities, and plot their longitude on the x-axis and their latitude on the y-axis. Draw line segments connecting the four points (4 lines forming the outside of a quadrilateral, and 2 diagonals). Find the equation of the line that forms each of the line segments, and the point of intersection of the quadrilateral's two diagonals. Show your work, and be sure to specify which points and lines you are describing. teview the data you collected in Learning Activity 4.6: Data investigation. Part A: Consider the data for your 20 cities. Create three scatter plots: One graphing the latitude against the average temperature, another graphing the longitude against the average hours of daylight, and a third comparing annual precipitation to distance to closest international airport. Part B: For each of the three graphs, find the line of best fit using technology. State the equation of the line, and lis coefficient of determination. Describe the relationship in each of the three plots. Part C: Select four of your cities, and plot their longitude on the x-axis and their latitude on the y-axis. Draw line segments connecting the four points (4 lines forming the outside of a quadrilateral, and 2 diagonals). Find the equation of the line that forms each of the line segments, and the point of intersection of the quadrilateral's two diagonals. Show your work, and be sure to specify which points and lines you are describing
Step by Step Solution
There are 3 Steps involved in it

Get step-by-step solutions from verified subject matter experts