

Question: Objective 2 Interpret data displayed in tables and graphically. 2b. Create a frequency distribution and histogram from a data set. You must create this by
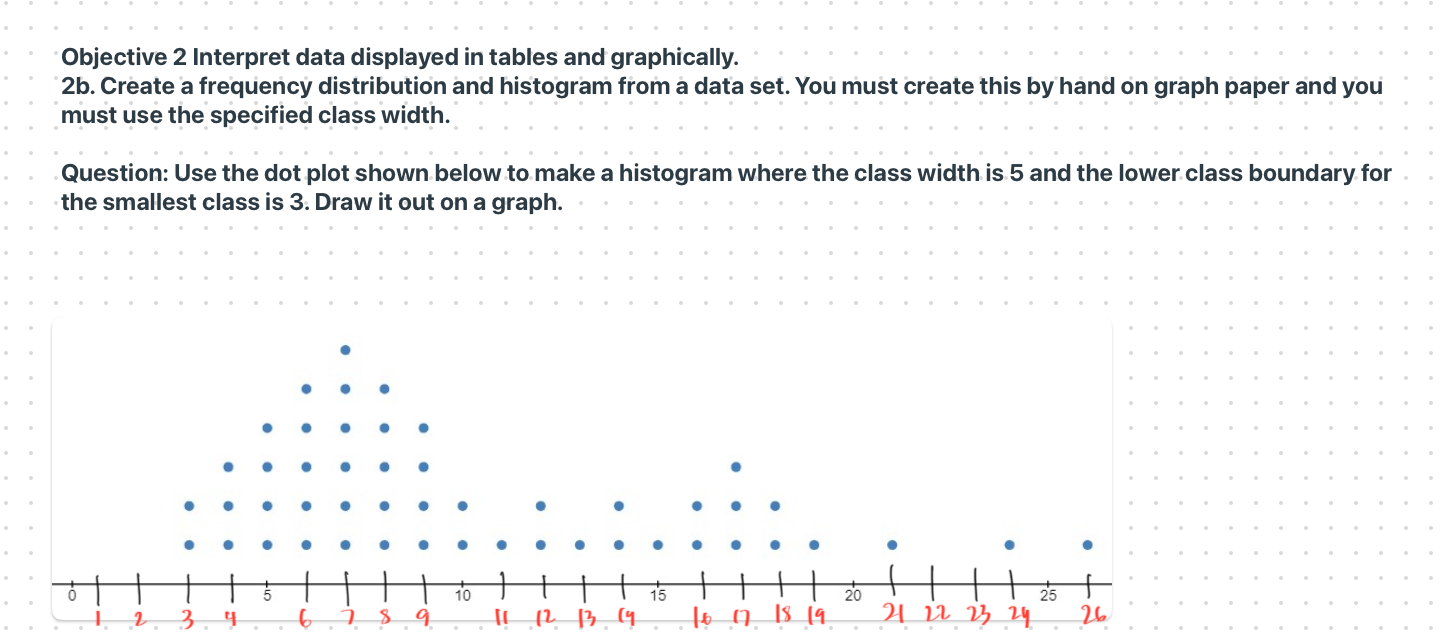
Objective 2 Interpret data displayed in tables and graphically. 2b. Create a frequency distribution and histogram from a data set. You must create this by hand on graph paper and you must use the specified class width. Question: Use the dot plot shown below to make a histogram where the class width is 5 and the lower class boundary for the smallest class is 3. Draw it out on a graph. 10 15 20 25 9 11 12 13 14 16 17 18 19 21 22 23 24 26
Step by Step Solution
There are 3 Steps involved in it
1 Expert Approved Answer
Step: 1 Unlock

Question Has Been Solved by an Expert!
Get step-by-step solutions from verified subject matter experts
Step: 2 Unlock
Step: 3 Unlock