

Question: Objective 3: Organize Continuous Data in Tables 0 of 4 Points Part 1 of 2 The data below represent the per capita (average) disposable (a)
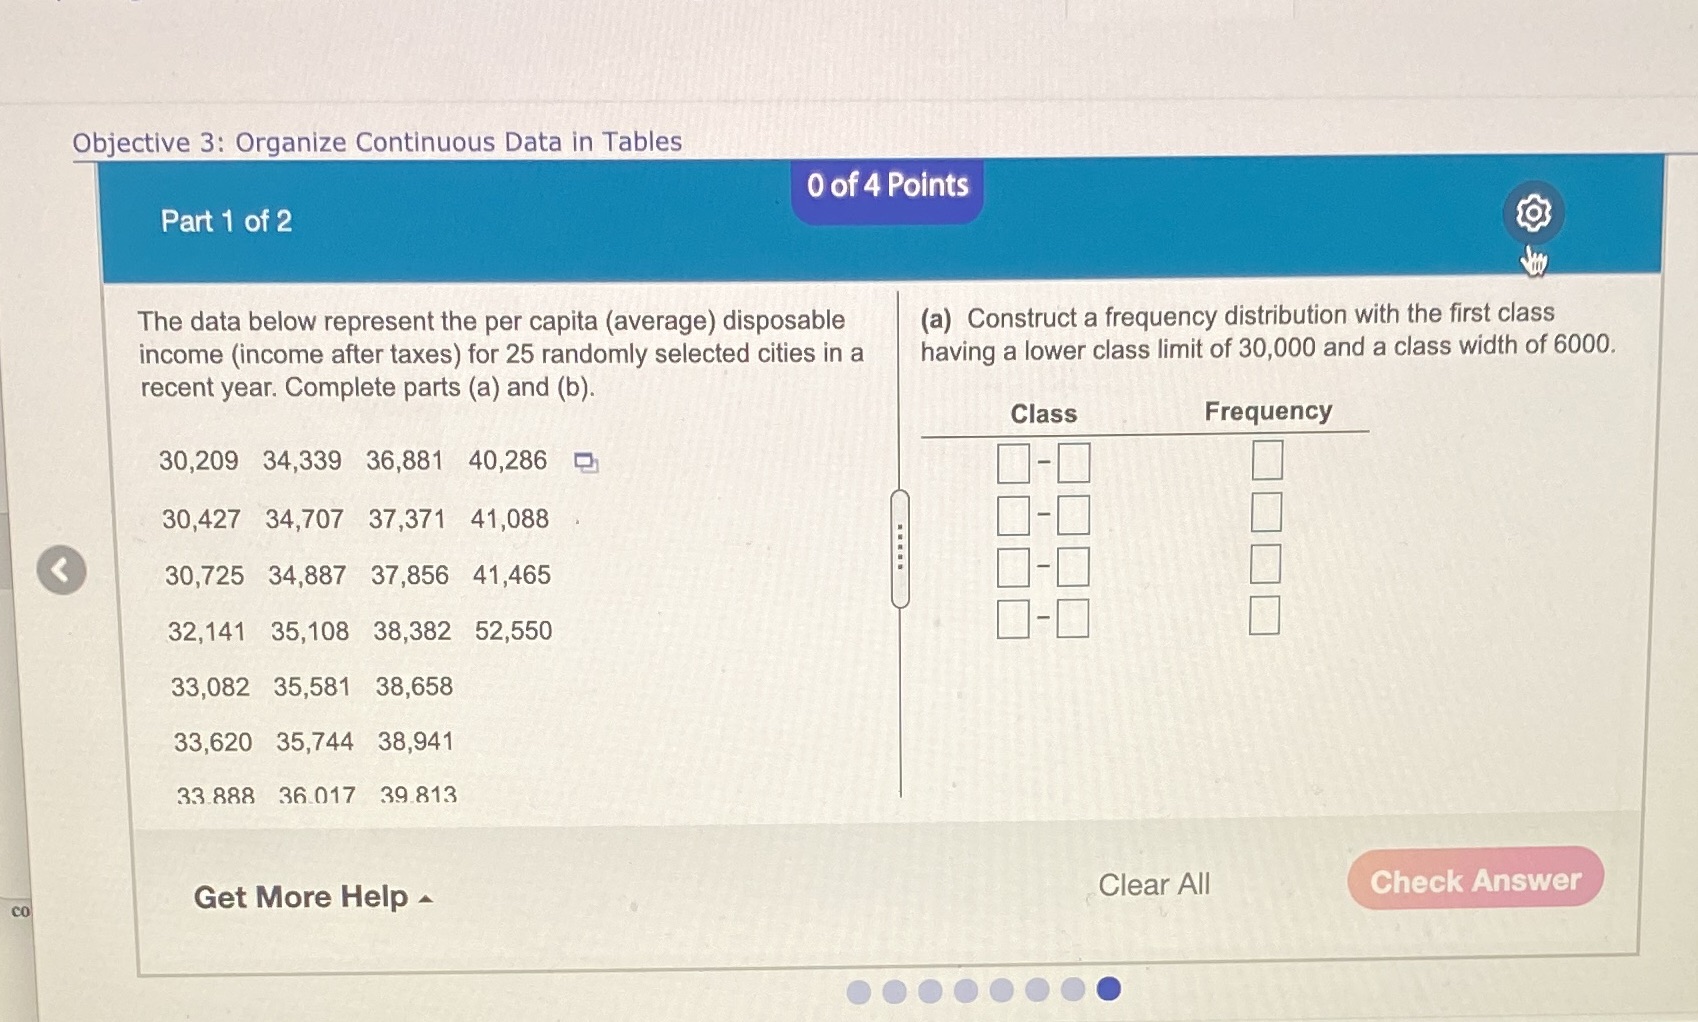
Objective 3: Organize Continuous Data in Tables 0 of 4 Points Part 1 of 2 The data below represent the per capita (average) disposable (a) Construct a frequency distribution with the first class income (income after taxes) for 25 randomly selected cities in a having a lower class limit of 30,000 and a class width of 6000. recent year. Complete parts (a) and (b). Class Frequency 30,209 34,339 36,881 40,286 30,427 34,707 37,371 41,088 30,725 34,887 37,856 41,465 32,141 35,108 38,382 52,550 33,082 35,581 38,658 33,620 35,744 38,941 33 888 36 017 39.813 Get More Help Clear All Check Answer CO
Step by Step Solution
There are 3 Steps involved in it
1 Expert Approved Answer
Step: 1 Unlock

Question Has Been Solved by an Expert!
Get step-by-step solutions from verified subject matter experts
Step: 2 Unlock
Step: 3 Unlock