

Question: points out Objective 4 Objective 5 Objective 6 Organize Continuous Data in Tables Organizing Quantitative Data: The Popular Displays art 1 of 2 0 of
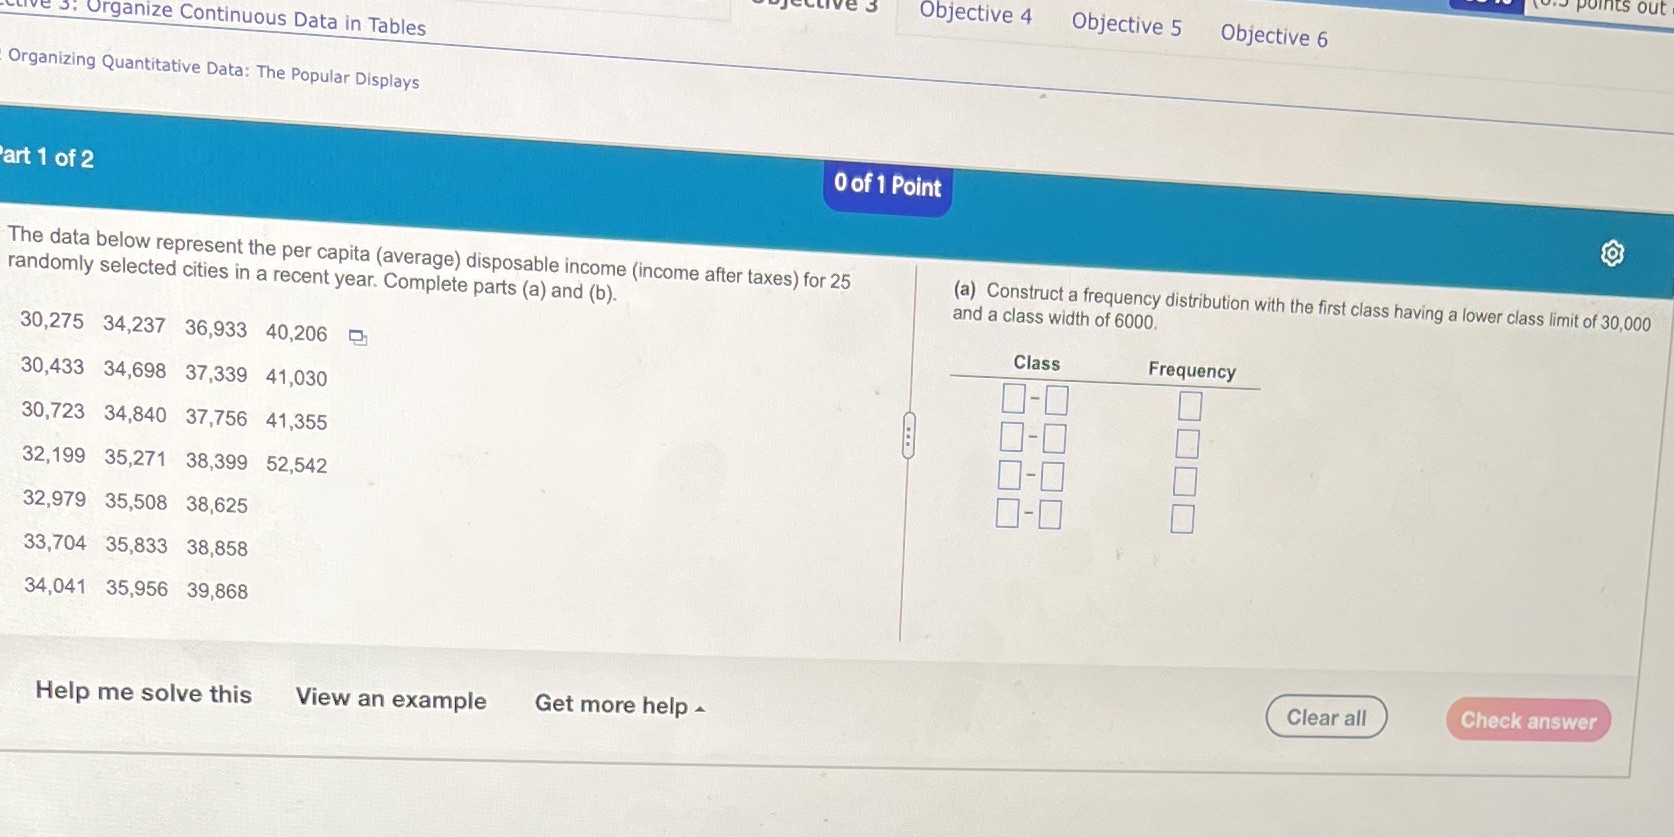
points out Objective 4 Objective 5 Objective 6 Organize Continuous Data in Tables Organizing Quantitative Data: The Popular Displays art 1 of 2 0 of 1 Point The data below represent the per capita (average) disposable income (income after taxes) for 25 (a) Construct a frequency distribution with the first class having a lower class limit of 30,000 randomly selected cities in a recent year. Complete parts (a) and (b). and a class width of 6000. 30,275 34,237 36,933 40,206 Class Frequency 30,433 34,698 37,339 41,030 0-0 30,723 34,840 37,756 41,355 32,199 35,271 38,399 52,542 32,979 35,508 38,625 33,704 35,833 38,858 34,041 35,956 39,868 Clear all Check answer Help me solve this View an example Get more help
Step by Step Solution
There are 3 Steps involved in it

Get step-by-step solutions from verified subject matter experts