

Question: Objective: Evaluate a companys solvency and profitability using publicly available information. Each student will select a company whose stock is publicly traded. The company must
Objective: Evaluate a companys solvency and profitability using publicly available information.
Each student will select a company whose stock is publicly traded. The company must be publicly traded to make sure that the student has ready access to the companys financial statements. Email me your choice of company before you begin to work on the project and I will let you know if it is acceptable and available. No more than one student can report on a particular company, so before you begin the work, you want to make sure the company you want to study has not already been selected by another student.
Overview of Company
Brief history of company, highlighting milestones; description of company's major business activities; identify auditors, board members and executive officers; summary of at least two news stories about the company; identify and describe at least two business or economic risks the company is facing, how the company is responding to those risks, and potential financial consequences
Common-size Statement Analysis
Prepare common-size balance sheets and income statements for the past three years
Ratio Analysis
Compute the following ratios for the latest two years and present the information in a table.
- Profitability
- Earnings per Share
- Gross Profit Percent
- Profit Margin
- Return on Assets
- Return on Common Equity
- Liquidity
- Cash Ratio
- Quick Ratio
- Current Ratio
- Liquidity Activity Ratios
- Accounts Receivable Turnover
- Days to Collect Receivables
- Inventory Turnover
- Days to Sell Inventory
- Capital structure and solvency
- Debt to Equity
- Times Interest Earned
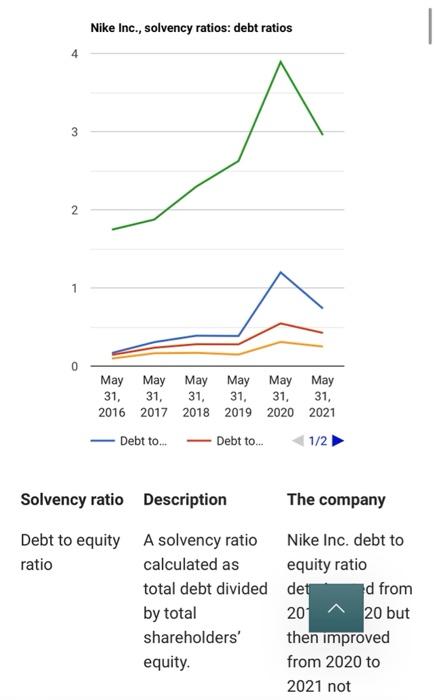
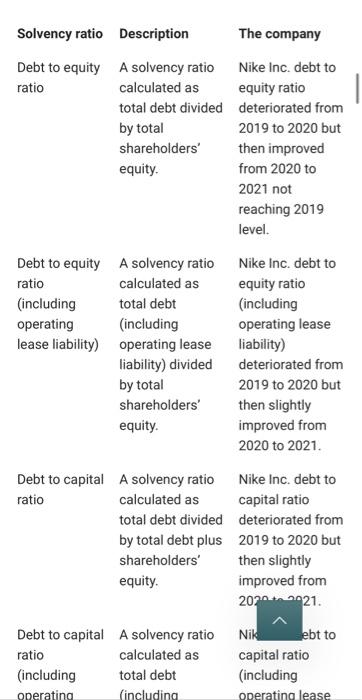
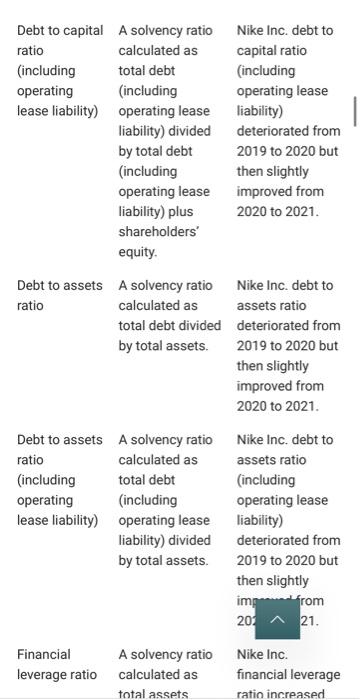
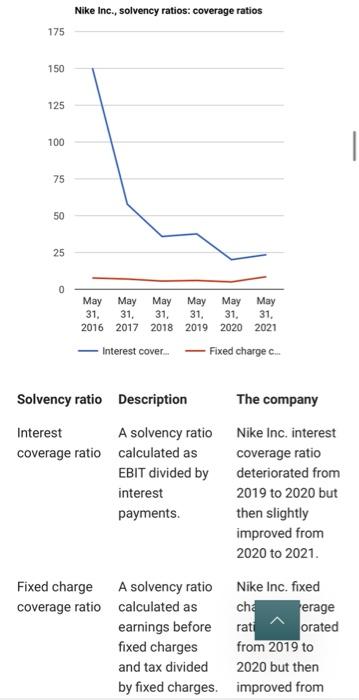
Nike Inc., solvency ratios: debt ratios 4 3 2 1 May May May May May May 31, 31, 31, 31, 31, 31, 2016 2017 2018 2019 2020 2021 Debt to. Debt to... 1/2 Solvency ratio Description The company Debt to equity A solvency ratio Nike Inc. debt to ratio calculated as equity ratio total debt divided det d from by total 20 ~ 20 but shareholders' then improved equity. from 2020 to 2021 not Solvency ratio Description The company Debt to equity A solvency ratio Nike Inc. debt to ratio calculated as equity ratio total debt divided deteriorated from by total 2019 to 2020 but shareholders' then improved equity. from 2020 to 2021 not reaching 2019 level. Debt to equity A solvency ratio ratio calculated as (including total debt operating (including lease liability) operating lease liability) divided by total shareholders' equity. Nike Inc. debt to equity ratio (including operating lease liability) deteriorated from 2019 to 2020 but then slightly improved from 2020 to 2021. Debt to capital A solvency ratio Nike Inc. debt to ratio calculated as capital ratio total debt divided deteriorated from by total debt plus 2019 to 2020 but shareholders' then slightly equity improved from 207.21. Debt to capital A solvency ratio ratio calculated as (including total debt operating (including Nike ebt to capital ratio (including operating lease Debt to capital A solvency ratio Nike Inc. debt to ratio calculated as capital ratio (including total debt (including operating (including operating lease lease liability) operating lease liability) liability) divided deteriorated from by total debt 2019 to 2020 but (including then slightly operating lease improved from liability) plus 2020 to 2021. shareholders' equity ratio Debt to assets A solvency ratio Nike Inc. debt to calculated as assets ratio total debt divided deteriorated from by total assets. 2019 to 2020 but then slightly improved from 2020 to 2021. Debt to assets A solvency ratio Nike Inc. debt to ratio calculated as assets ratio (including total debt (including operating (including operating lease lease liability) operating lease liability) liability) divided deteriorated from by total assets. 2019 to 2020 but then slightly imperom 203 21. Financial leverage ratio A solvency ratio calculated as total assets Nike Inc. financial leverage ratio increased Nike Inc., solvency ratios: coverage ratios 175 150 125 100 75 50 25 0 31, 31. 31. May May May May May May 31. 31. 31. 2016 2017 2018 2019 2020 2021 Interest cover Fixed charge c.. Solvency ratio Description The company Interest A solvency ratio coverage ratio calculated as EBIT divided by interest payments. Nike Inc. interest coverage ratio deteriorated from 2019 to 2020 but then slightly improved from 2020 to 2021 Fixed charge A solvency ratio Nike Inc. fixed coverage ratio calculated as cha erage earnings before rati orated fixed charges from 2019 to and tax divided 2020 but then by fixed charges. improved from
Step by Step Solution
There are 3 Steps involved in it

Get step-by-step solutions from verified subject matter experts