

Question: Objective: This assignment tests a students ability to operate MS Excel (specifically the absolute value) and perform critical thinking on a given business problem. Problem
Objective: This assignment tests a students ability to operate MS Excel (specifically the absolute value) and perform critical thinking on a given business problem.
Problem Statement: Your small retail shop specializes in high-end mountain bikes. At this time your store does not have any other products. You buy them from the distributors and stock them in your shop. You have one employee beside yourself to help assemble and sell these bicycles. You need to develop a simple spreadsheet model to help you monitor the operations of this business and to help you track your projected profit (or loss) for the coming year. You would like to know which bikes are the most profitable, and you need to be able to see how other costs such as rent and utilities might affect your overall net profit or loss within that time frame. You have decided to develop a model using an MS Excel spreadsheet. It is intended that this model will become a part of your Decision Support System (DSS). It should provide an instant answer as to the profitability of a given product at a given cost or selling price. It must also allow you to examine different scenarios when manipulating the product line offered and the set of key variables such as markup, rent, and utilities. The selling price is based on a percentage markup over the cost and is derived by a formula.
Do NOT join the tables into one. Make them separate.
Your Tasks and the Expected Outcome:
Spreadsheet:
Develop a model that will determine the results indicated based on the data provided above. This must be done by using formulas and cell references (variable or absolute location $) in the MS Excel spreadsheet. All of the items shown as $??? must be calculated using a formula or obtained by inserting a cell reference that provides a link to another cell. (Note: do NOT use the Table feature in Excel )
The model must recalculate the results when any of the input values (i.e., projected sales, markup, cost per unit) that were provided are changed. This is required in order to illustrate the principle of What-If analysis. (Note: It is not necessary to use the What-If utility of Excel)
Sales Income Chart:
Develop a chart to graphically illustrate the total Sales Income for each bicycle model. A change in the input parameters must impact the chart.
Scenario Analysis (do not use the excel provided what if tool):
Use the model you created (the excel spreadsheet with formulas) to help the Bike Shop decide on a strategy that would make them profitable. In coming up with possible actions to take, use the Decision Making Model illustrated at the end of this document to come up with three options that the Bike Shop could take to increase profits and use the Excel model to test the options.
When done with your analysis, write a description in a separate MS Word document of the following: Bikes Shop problem, the three possible course of action to increase profit, and the one option that you would recommend as the most effective in making the Bike Shop profitable. Be specific on the changes that would result in the Excel model if each option was implemented (i.e., test each one using the model). Remember, in providing a recommendation on what is the best option be critical and ensure the recommendation is feasible and will bring about the desired results.
In the 2nd part, the three options must be done using Excel calculations.
Show those three options in three separate sheets within the same Excel file.
Notes:
- use the correct absolute cell reference formula (eg. $A$20 there must be two $ signs, no exception)
- create a total of four Excel sheets (original, option 1, option 2, option 3) and in each sheet, there must be all five tables WITH the correct absolute cell reference formula.
- write up a discussion on three alternative options using paragraphs and the final paragraph stating WHY one option is better than the two other options. The discussions must be elaborated in explaining why so, not just stating the facts.
- Warning: Do NOT combine the tables in to one large table
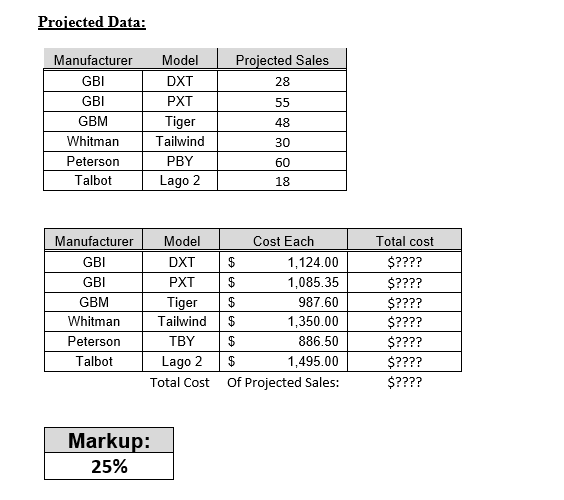
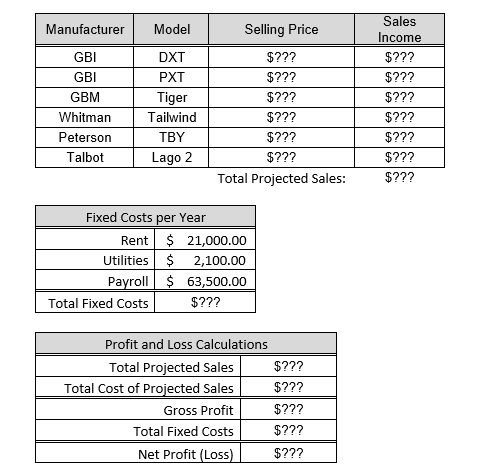
Projected Data: Manufacturer Projected Sales 28 GBI GBI 55 Model DXT PXT Tiger Tailwind PBY Lago 2 48 GBM Whitman Peterson Talbot 30 60 18 $ Manufacturer GBI GBI GBM Whitman Peterson Talbot Model DXT PXT Tiger Tailwind TBY Lago 2 Total Cost Cost Each 1,124.00 $ 1,085.35 987.60 $ 1,350.00 $ 886.50 $ 1,495.00 Of Projected Sales: Total cost $???? $???? $???? $???? $???? $???? $???? Markup: 25% Manufacturer Model Selling Price GBI GBI GBM Whitman Peterson Talbot DXT PXT Tiger Tailwind TBY Lago 2 $??? $??? $??? $??? $??? $??? Total Projected Sales: Sales Income $??? $??? $??? $??? $??? $??? $??? Fixed Costs per Year Rent $ 21,000.00 Utilities $ 2,100.00 Payroll $ 63,500.00 Total Fixed Costs $??? Profit and Loss Calculations Total Projected Sales $??? Total Cost of Projected Sales $??? Gross Profit $??? Total Fixed Costs $??? Net Profit (Loss) $
Step by Step Solution
There are 3 Steps involved in it

Get step-by-step solutions from verified subject matter experts