

Question: Building a Decision Support System with MS Excel: A Spreadsheet Modeling Assignment Objective: This assignment tests your ability to operate MS Excel (specifically the absolute
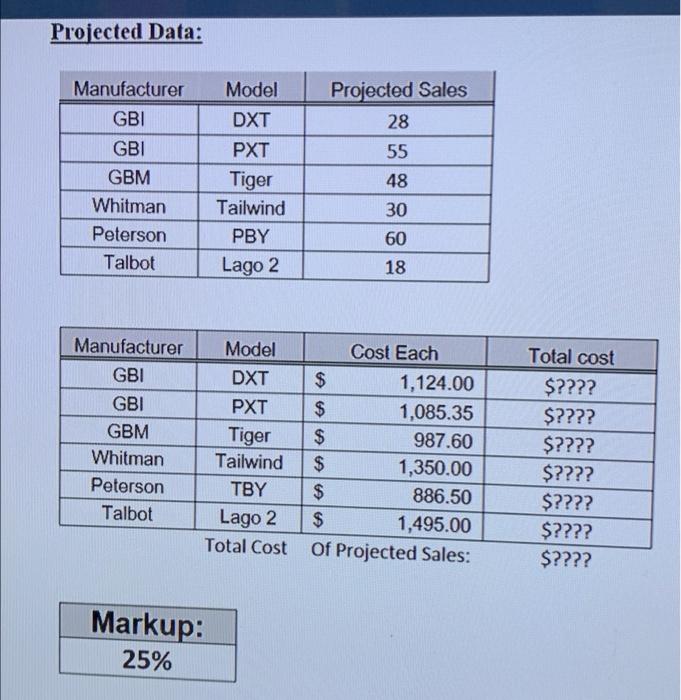
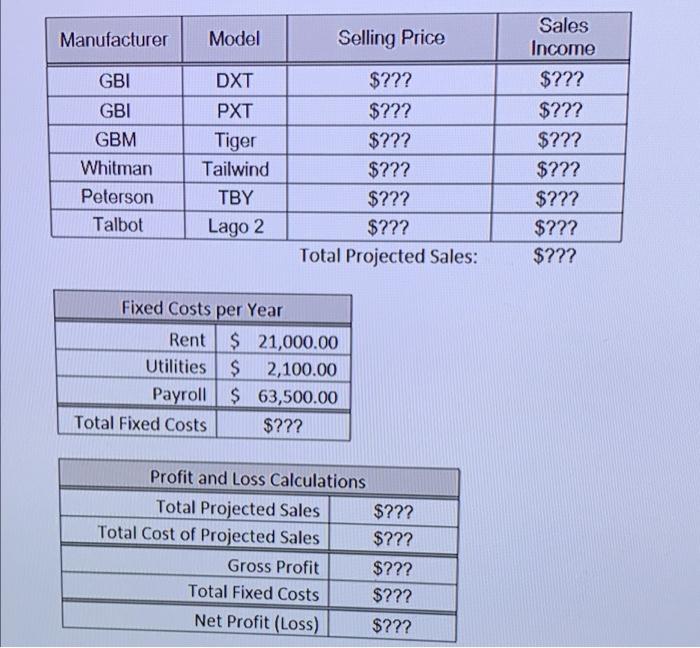
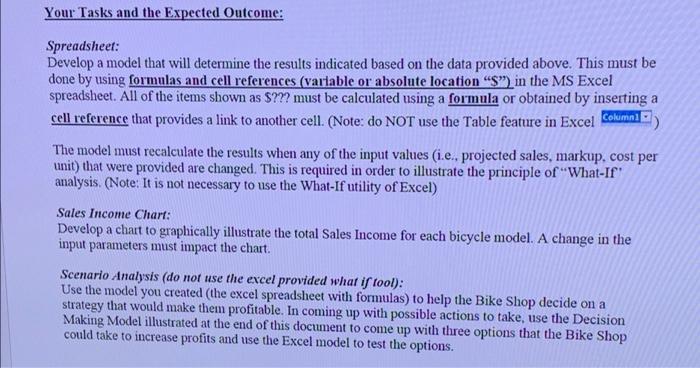
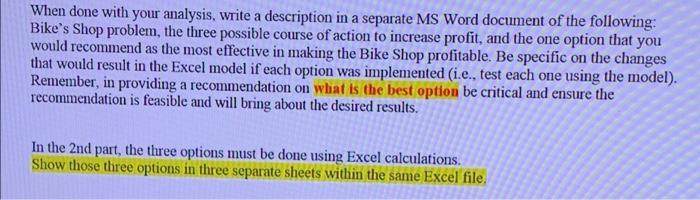
Projected Data: Projected Sales 28 55 Manufacturer GBI GBI GBM Whitman Peterson Talbot Model DXT PXT Tiger Tailwind PBY Lago 2 48 30 60 18 Manufacturer GBI GBI GBM Whitman Peterson Talbot Model DXT PXT Tiger Tailwind TBY Lago 2 Total Cost AGAI GAGA Cost Each $ 1,124.00 $ 1,085.35 $ 987.60 $ 1,350.00 $ 886.50 $ 1,495.00 Of Projected Sales: Total cost $???? $???? $???? $???? $???? $???? $???? Markup: 25% Manufacturer Model Selling Price GBI GBI GBM Whitman Peterson Talbot DXT PXT Tiger Tailwind TBY Lago 2 $??? $??? $??? $??? $??? $??? Total Projected Sales: Sales Income $??? $??? $??? $??? $??? $??? $??? Fixed Costs per Year Rent $ 21,000.00 Utilities $ 2,100.00 Payroll $ 63,500.00 Total Fixed Costs $??? Profit and Loss Calculations Total Projected Sales $??? Total Cost of Projected Sales $??? Gross Profit $??? Total Fixed Costs $??? Net Profit (Loss) $??? Your Tasks and the Expected Outcome: Spreadsheet: Develop a model that will determine the results indicated based on the data provided above. This must be done by using formulas and cell references (variable or absolute location "S" in the MS Excel spreadsheet. All of the items shown as $??? must be calculated using a formula or obtained by inserting a cell reference that provides a link to another cell. (Note: do NOT use the Table feature in Excel Columna The model must recalculate the results when any of the input values (i.e., projected sales, markup. cost per unit) that were provided are changed. This is required in order to illustrate the principle of "What-If analysis. (Note: It is not necessary to use the What-If utility of Excel) Sales Income Chart: Develop a chart to graphically illustrate the total Sales Income for each bicycle model. A change in the input parameters must impact the chart. Scenario Analysis (do not use the excel provided what is tool): Use the model you created the excel spreadsheet with formulas) to help the Bike Shop decide on a strategy that would make them profitable. In coming up with possible actions to take, use the Decision Making Model illustrated at the end of this document to come up with three options that the Bike Shop could take to increase profits and use the Excel model to test the options. When done with your analysis, write a description in a separate MS Word document of the following: Bike's Shop problem, the three possible course of action to increase profit, and the one option that you would recommend as the most effective in making the Bike Shop profitable. Be specific on the changes that would result in the Excel model if each option was implemented (i.e., test each one using the model). Remember, in providing a recommendation on what is the best option be critical and ensure the recommendation is feasible and will bring about the desired results. In the 2nd part, the three options must be done using Excel calculations. Show those three options in three separate sheets within the same Excel file
Step by Step Solution
There are 3 Steps involved in it

Get step-by-step solutions from verified subject matter experts