

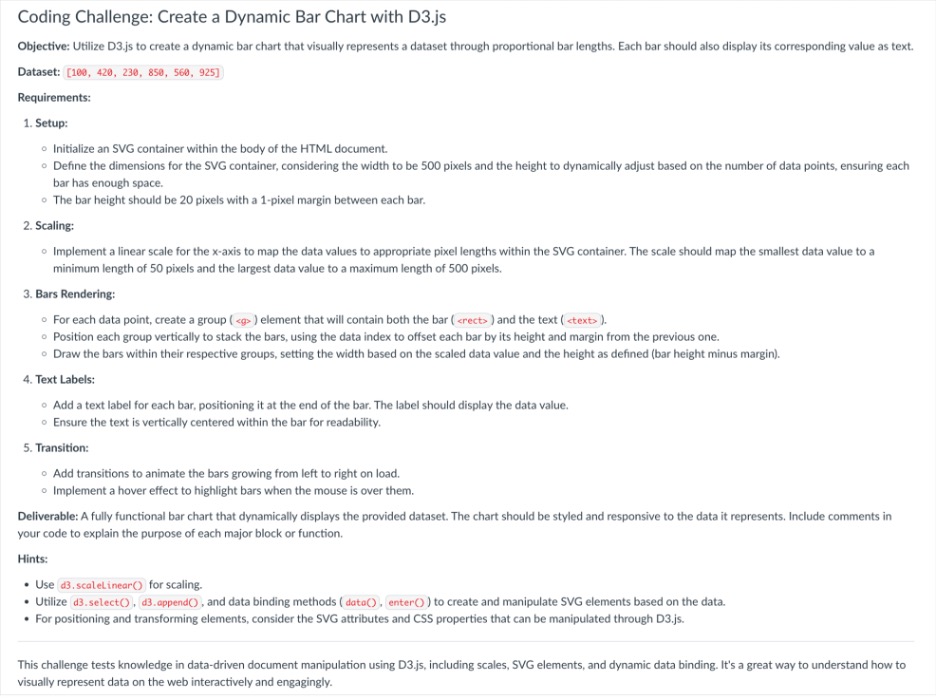
Question: Objective: Utilize D 3 . js to create a dynamic bar chart that visually represents a dataset through proportional bar lengths. Each bar should also
Objective: Utilize Djs to create a dynamic bar chart that visually represents a dataset through proportional bar lengths. Each bar should also display its corresponding value as text.
Dataset:
Requirements:
Setup:
Initialize an SVG container within the body of the HTML document.
Define the dimensions for the SVG container, considering the width to be pixels and the height to dynamically adjust based on the number of data points, ensuring each
bar has enough space.
The bar height should be pixels with a pixel margin between each bar.
Scaling:
Implement a linear scale for the axis to map the data values to appropriate pixel lengths within the SVG container. The scale should map the smallest data value to a
minimum length of pixels and the largest data value to a maximum length of pixels.
Bars Rendering:
For each data point, create a group
Step by Step Solution
There are 3 Steps involved in it
1 Expert Approved Answer
Step: 1 Unlock

Question Has Been Solved by an Expert!
Get step-by-step solutions from verified subject matter experts
Step: 2 Unlock
Step: 3 Unlock