

Question: OBLEMS 1. Use the Analysis ToolPak Histogram feature and the data in Figure 5.6 to create a cumulative percentage histogram of the students' midterm exam
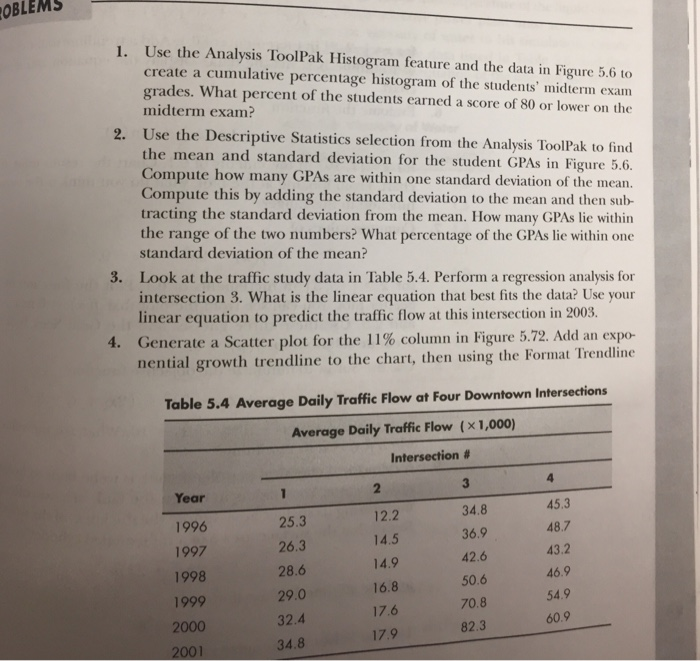
OBLEMS 1. Use the Analysis ToolPak Histogram feature and the data in Figure 5.6 to create a cumulative percentage histogram of the students' midterm exam grades. What percent of the students earned a score of 80 or lower on the midterm exam? 2. Use the Descriptive Statistics selection from the Analysis ToolPak to find the mean and standard deviation for the student GPAs in Figure 5.6. Compute how many GPAs are within one standard deviation of the mean. Compute this by adding the standard deviation to the mean and then sub- tracting the standard deviation from the mean. How many GPAs lie within the range of the two numbers? What percentage of the GPAs lie within one standard deviation of the mean? 3. Look at the traffic study data in Table 5.4. Perform a regression analysis for intersection 3. What is the linear equation that best fits the data? Use your linear equation to predict the traffic flow at this intersection in 2003. 4, Generate a Scatter plot for the 11% column in Figure 5.72. Add an expo- nential growth trendline to the chart, then using the Format Trendline Table 5.4 Average Daily Traffic Flow at Four Downtown Intersections Average Daily Traffic Flow (x1,000) Intersection # Year 1996 1997 1998 1999 2000 2001 25.3 26.3 28.6 29.0 32.4 34.8 12.2 14.5 14.9 16.8 17.6 17.9 34.8 36.9 42.6 50.6 70.8 82.3 45.3 48.7 43.2 46.9 54.9 60.9 OBLEMS 1. Use the Analysis ToolPak Histogram feature and the data in Figure 5.6 to create a cumulative percentage histogram of the students' midterm exam grades. What percent of the students earned a score of 80 or lower on the midterm exam? 2. Use the Descriptive Statistics selection from the Analysis ToolPak to find the mean and standard deviation for the student GPAs in Figure 5.6. Compute how many GPAs are within one standard deviation of the mean. Compute this by adding the standard deviation to the mean and then sub- tracting the standard deviation from the mean. How many GPAs lie within the range of the two numbers? What percentage of the GPAs lie within one standard deviation of the mean? 3. Look at the traffic study data in Table 5.4. Perform a regression analysis for intersection 3. What is the linear equation that best fits the data? Use your linear equation to predict the traffic flow at this intersection in 2003. 4, Generate a Scatter plot for the 11% column in Figure 5.72. Add an expo- nential growth trendline to the chart, then using the Format Trendline Table 5.4 Average Daily Traffic Flow at Four Downtown Intersections Average Daily Traffic Flow (x1,000) Intersection # Year 1996 1997 1998 1999 2000 2001 25.3 26.3 28.6 29.0 32.4 34.8 12.2 14.5 14.9 16.8 17.6 17.9 34.8 36.9 42.6 50.6 70.8 82.3 45.3 48.7 43.2 46.9 54.9 60.9
Step by Step Solution
There are 3 Steps involved in it

Get step-by-step solutions from verified subject matter experts