

Question: Observations 16 Sample No. 1 2 3 4 1 23 22 23 24 2 23 21 19 21 3 20 19 20 21 4 20
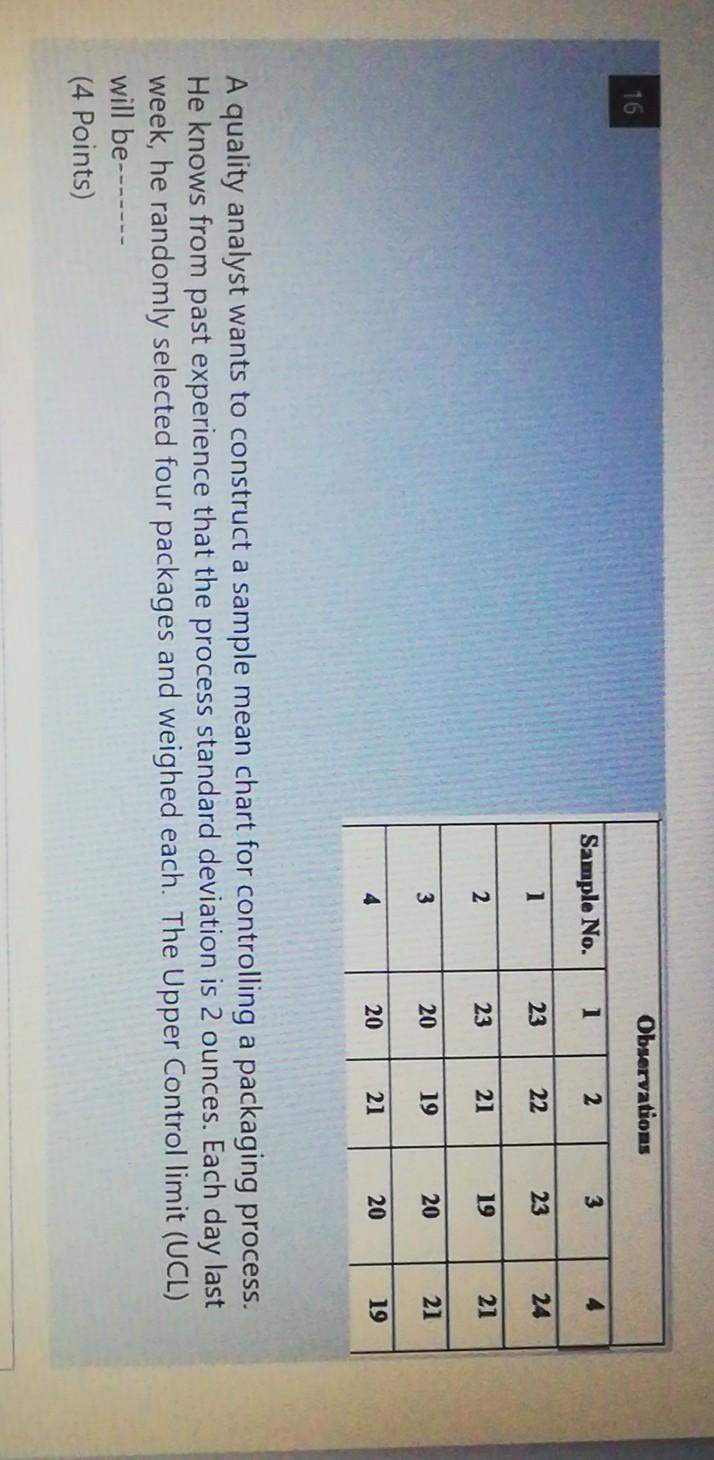
Observations 16 Sample No. 1 2 3 4 1 23 22 23 24 2 23 21 19 21 3 20 19 20 21 4 20 21 20 19 A quality analyst wants to construct a sample mean chart for controlling a packaging process. He knows from past experience that the process standard deviation is 2 ounces. Each day last week, he randomly selected four packages and weighed each. The Upper Control limit (UCL) will be------- (4 Points)
Step by Step Solution
There are 3 Steps involved in it
1 Expert Approved Answer
Step: 1 Unlock

Question Has Been Solved by an Expert!
Get step-by-step solutions from verified subject matter experts
Step: 2 Unlock
Step: 3 Unlock