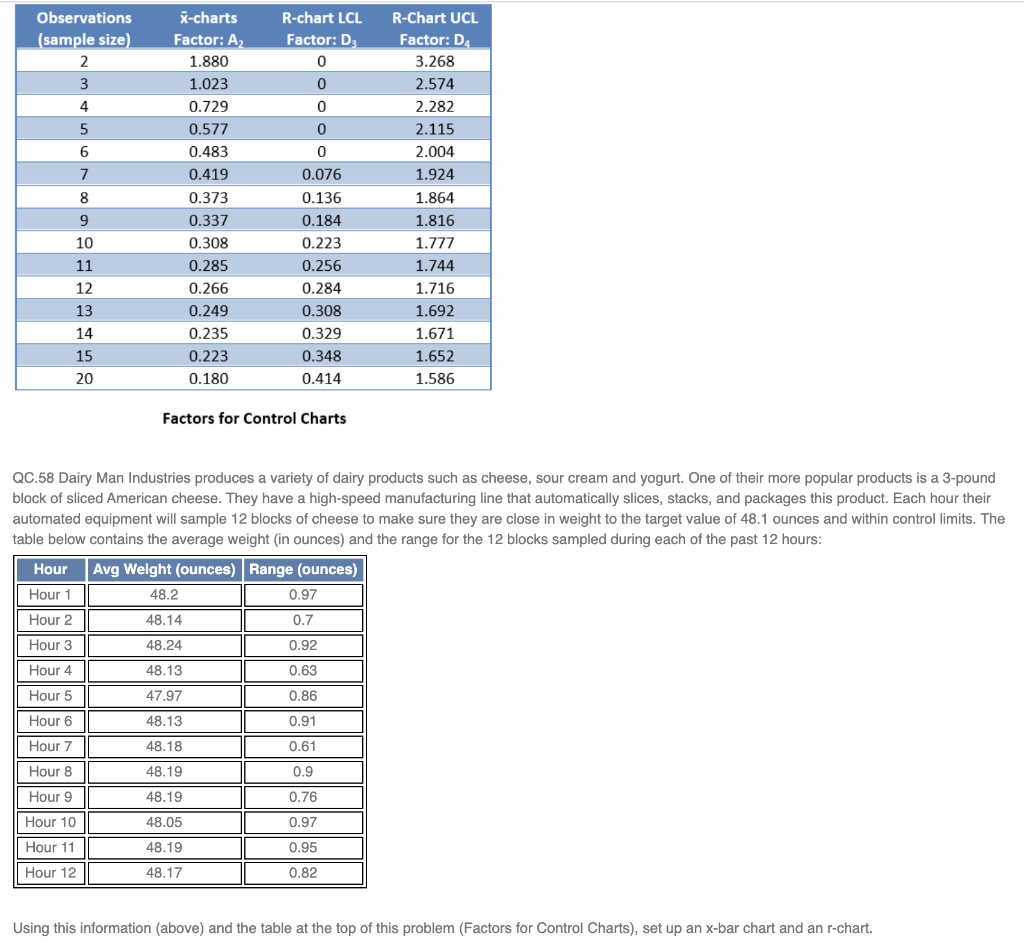
Question: Observations (sample size) R-chart LCL Factor: D 0 0 O - 5 0 X-charts Factor: A 1.880 1.023 0.729 0.577 0.483 0.419 0.373 0.337 0.308

Observations (sample size) R-chart LCL Factor: DObservations (sample size) R-chart LCL Factor: D

Observations (sample size) R-chart LCL Factor: D 0 0 O - 5 0 X-charts Factor: A 1.880 1.023 0.729 0.577 0.483 0.419 0.373 0.337 0.308 0.285 0.266 0.249 0.235 0.223 0.180 R-Chart UCL Factor: DA 3.268 2.574 2.282 2.115 2.004 1.924 1.864 1.816 1.777 1.744 1.716 1.692 1.671 1.652 1.586 0.076 0.136 0.184 0.223 0.256 0.284 0.308 0.329 0.348 0.414 11 12 13 14 15 20 Factors for Control Charts QC.58 Dairy Man Industries produces a variety of dairy products such as cheese, sour cream and yogurt. One of their more popular products is a 3-pound block of sliced American cheese. They have a high-speed manufacturing line that automatically slices, stacks, and packages this product. Each hour their automated equipment will sample 12 blocks of cheese to make sure they are close in weight to the target value of 48.1 ounces and within control limits. The table below contains the average weight (in ounces) and the range for the 12 blocks sampled during each of the past 12 hours: Hour Hour 1 Hour 2 Avg Weight (ounces) Range (ounces) 48.2 0.97 48.14 0.7 48.24 0.92 48.13 0.63 Hour 3 Hour 4 Hour 5 47.97 0.86 Hour 6 0.91 0.61 Hour 7 48.13 48.18 48.19 48.19 Hour 8 0.9 0.76 Hour 9 Hour 10 48.05 0.97 Hour 11 || 48.19 0.95 Hour 12 48.17 0.82 Using this information (above) and the table at the top of this problem (Factors for Control Charts), set up an x-bar chart and an r-chart. What is the average of the sample means for this data? (Display your answer to two decimal places.) 48.15 In this case, what should be used as the target value for the construction of the x-bar chart? The sample mean (computed in the previous question) The process target (48.1 ounces) The average between the process target and the sample mean What is the average range for this data? (Display your answer to two decimal places.) 0.83 O What is the upper control limit for the x-bar chart? (Display your answer to two decimal places.) 0.05 What is the lower control limit for the x-bar chart? (Display your answer to two decimal places.) 0.30 What is the upper control limit for the r-chart? (Display your answer to two decimal places.) 1.43 What is the lower control limit for the r-chart? (Display your answer to two decimal places.) 0.24 0

Step by Step Solution

There are 3 Steps involved in it

1 Expert Approved Answer
Step: 1 Unlock blur-text-image
Question Has Been Solved by an Expert!

Get step-by-step solutions from verified subject matter experts

Step: 2 Unlock
Step: 3 Unlock

Students Have Also Explored These Related General Management Questions!