

Question: Please give me the table, calculations and graphs. In graph must include UCL upper control limit, LCL lower control limit, and CL central line Use
Please give me the table, calculations and graphs. In graph must include UCL upper control limit, LCL lower control limit, and CL central line Use Excel, plot chart for X and R. please dont copy other work someone was copying other experter work and paste the work.
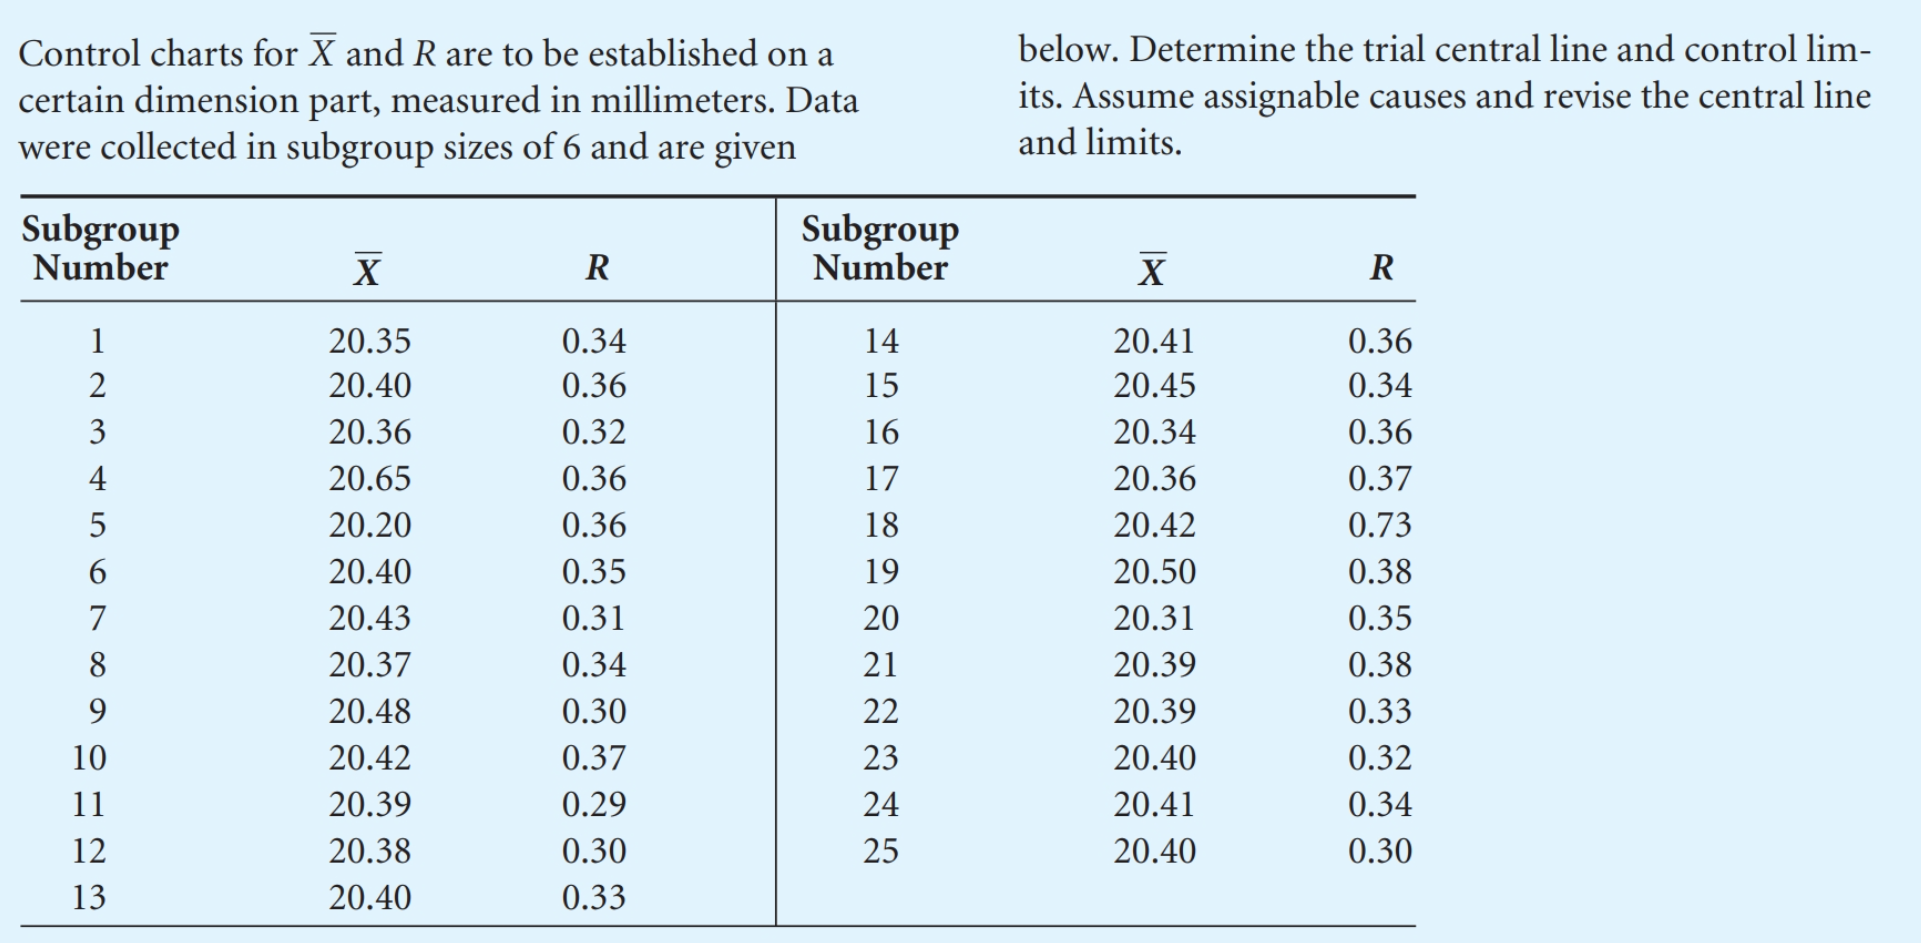
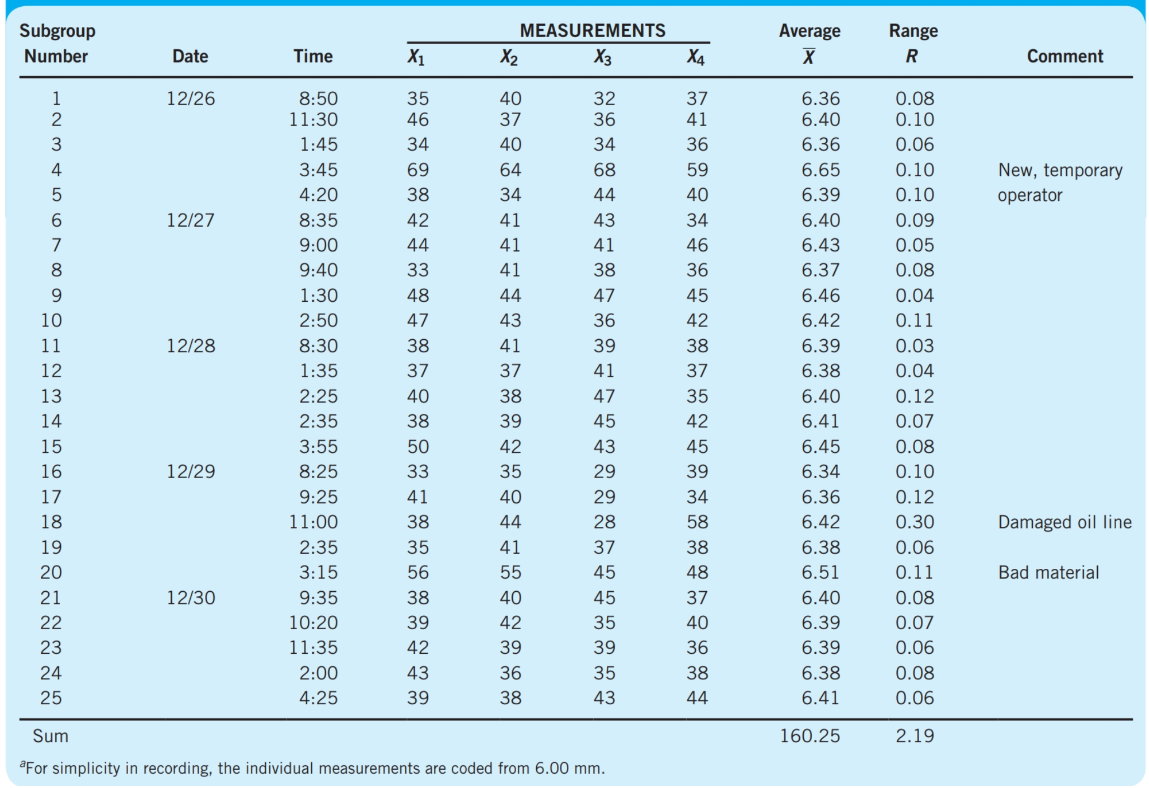
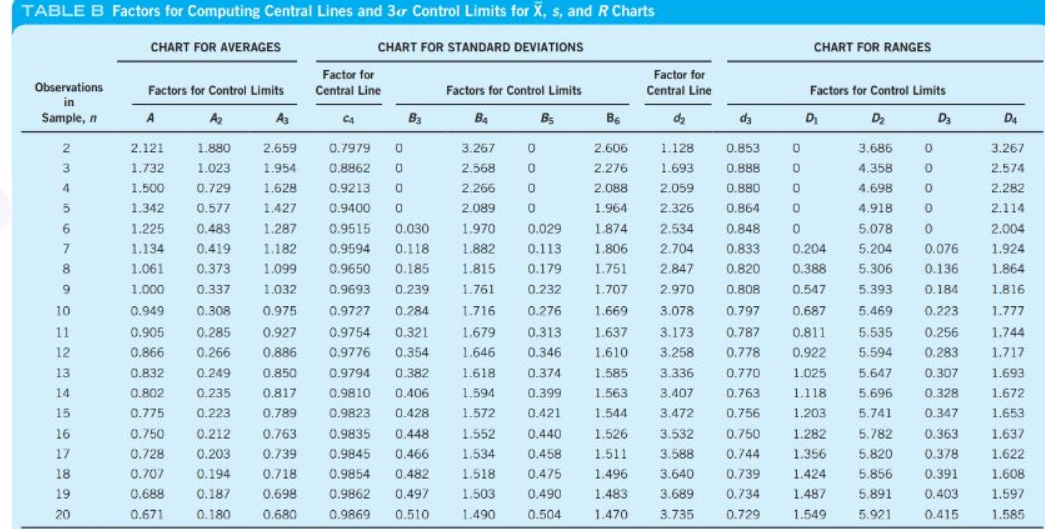
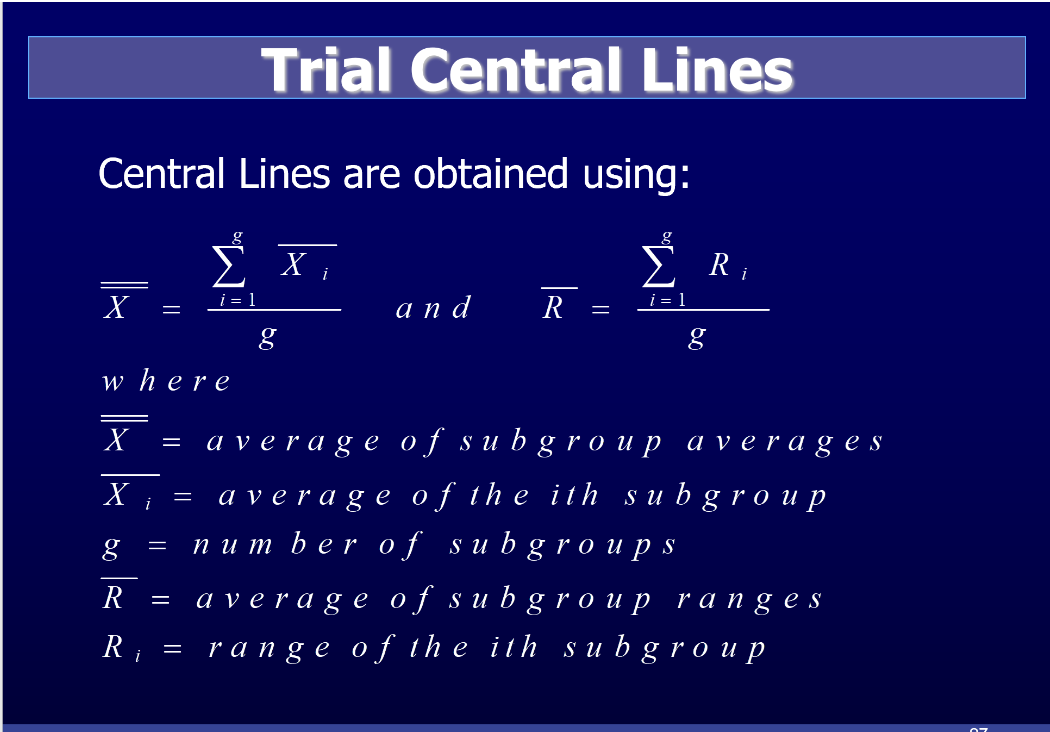

Control charts for X and R are to be established on a certain dimension part, measured in millimeters. Data were collected in subgroup sizes of 6 and are given below. Determine the trial central line and control lim- its. Assume assignable causes and revise the central line and limits. Subgroup Number Subgroup Number X R x R 1 2 3 4 5 6 7 8 9 10 11 12 13 20.35 20.40 20.36 20.65 20.20 20.40 20.43 20.37 20.48 20.42 20.39 20.38 20.40 0.34 0.36 0.32 0.36 0.36 0.35 0.31 0.34 0.30 0.37 0.29 0.30 0.33 14 15 16 17 18 19 20 21 22 23 20.41 20.45 20.34 20.36 20.42 20.50 20.31 20.39 20.39 20.40 20.41 20.40 0.36 0.34 0.36 0.37 0.73 0.38 0.35 0.38 0.33 0.32 0.34 0.30 24 25 Subgroup Number MEASUREMENTS X2 X3 Average Range R Date Time X1 X4 Comment 12/26 New, temporary operator 12/27 12/28 1 2 3 4 5 6 7 8 9 10 11 12 13 14 15 16 17 18 19 20 21 22 23 24 25 8:50 11:30 1:45 3:45 4:20 8:35 9:00 9:40 1:30 2:50 8:30 1:35 2:25 2:35 3:55 8:25 9:25 11:00 2:35 3:15 9:35 10:20 11:35 2:00 4:25 35 46 34 69 38 42 44 33 48 47 38 37 40 38 50 33 41 38 35 56 38 39 42 43 39 40 37 40 64 34 41 41 41 44 43 41 37 38 39 42 35 40 44 41 55 40 42 39 36 38 32 36 34 68 44 43 41 38 47 36 39 41 47 45 43 29 29 28 37 45 45 35 39 35 43 37 41 36 59 40 34 46 36 45 42 38 37 35 42 45 39 34 58 38 48 37 40 36 38 44 6.36 6.40 6.36 6.65 6.39 6.40 6.43 6.37 6.46 6.42 6.39 6.38 6.40 6.41 6.45 6.34 6.36 6.42 6.38 6.51 6.40 6.39 6.39 6.38 6.41 0.08 0.10 0.06 0.10 0.10 0.09 0.05 0.08 0.04 0.11 0.03 0.04 0.12 0.07 0.08 0.10 0.12 0.30 0.06 0.11 0.08 0.07 0.06 0.08 0.06 12/29 Damaged oil line Bad material 12/30 Sum 160.25 2.19 a For simplicity in recording, the individual measurements are coded from 6.00 mm. TABLE B Factors for Computing Central Lines and 3c Control Limits for X, s, and R Charts CHART FOR AVERAGES CHART FOR RANGES Factor for Central Line CHART FOR STANDARD DEVIATIONS Factor for Central Line Factors for Control Limits C4 B3 BA Bs Factors for Control Limits Observations in Sample, n Factors for Control Limits Az A3 6 dz D2 Dz D4 0 0 2 2 3 4 5 2.659 1.954 1.628 0 0 0 0 0 0 0.853 0.888 0.880 0.864 0.848 1.427 0.7979 0.8862 0.9213 0.9400 0.9515 0.9594 0.9650 3.267 2.568 2.266 2.089 1.970 1.882 1.815 1.128 1.693 2.059 2.326 2.534 2.704 2.847 0 1.880 1.023 0.729 0.577 0.483 0.419 0.373 0.337 0.308 0.285 0.266 0.249 0 0.030 0.118 0.185 6 7 3.686 4.358 4.698 4.918 5.078 5.204 5.306 1.287 1.182 1.099 0.833 0 0.204 0.388 0.547 8 9 1.032 0.9693 0.239 3.267 2.574 2.282 2.114 2.004 1.924 1.864 1.816 1.777 1.744 1.717 1.693 1.672 1.653 1.761 2.970 5.393 10 2.121 1.732 1.500 1.342 1.225 1.134 1.061 1.000 0.949 0.905 0.866 0.832 0.802 0.775 0.750 0.728 0.707 0.688 0.671 0.687 11 12 13 14 15 16 17 1.716 1.679 1.646 1.618 0.284 0.321 0.354 0.382 0.406 0.428 0 0 0 0 0.029 0.113 0.179 0.232 0.276 0.313 0.346 0.374 0.399 0.421 0.440 0.458 0.475 0.490 0.504 2.606 2.276 2.088 1.964 1.874 1.806 1.751 1.707 1.669 1.637 1.610 1.585 1.563 1.544 1.526 1.511 1.496 1.483 1.470 0.975 0.927 0.886 0.850 0.817 0.789 0.763 0.739 0.718 0.698 0.680 0.9727 0.9754 0.9776 0.9794 0.9810 0.9823 0.9835 0.9845 0.9854 0.9862 0.9869 0.235 1.594 0.820 0.808 0.797 0.787 0.778 0.770 0.763 0.756 0.750 0.744 0.739 0.734 0.729 0.223 0 0 0.076 0.136 0.184 0.223 0.256 0.283 0.307 0.328 0.347 0.363 0.378 0.391 0,403 0.415 3.078 3.173 3.258 3.336 3.407 3.472 3.532 3.588 3.640 3.689 3.735 0.811 0.922 1.025 1.118 1.203 1.282 1.356 1.424 1.487 1.549 5.469 5.535 5.594 5.647 5.696 5.741 5.782 5.820 5.856 5.891 5.921 1.572 1.552 1.534 1.518 1.503 1.490 0.212 0.203 0.194 0.448 0.466 0.482 0.497 0.510 18 19 1.637 1.622 1.608 1.597 1.585 0.187 0.180 20 Trial Central Lines Central Lines are obtained using: R, i X = i=1 = i=1 a n d R. - g g where X = = X i = = a verage of sub group averages a verage of the ith subgroup number of sub groups a verage of subgroup ranges range of the ith sub group R = Ri = Trial Control Limits In practice calculations are simplified by using the following equations where A2,D3 and D4 are factors that vary with the subgroupsize and are found in Table B of the Appendix. = UCL = X + A, R UCLR = DAR LCLJ = X AR LCLR = DR
Step by Step Solution
There are 3 Steps involved in it

Get step-by-step solutions from verified subject matter experts