Question: Ocean State Circuits Demand Analysis and Forecasting Exercise (Total 50 points) Your team has just been hired as Operations Analysts at Ocean State Circuits (OSC).
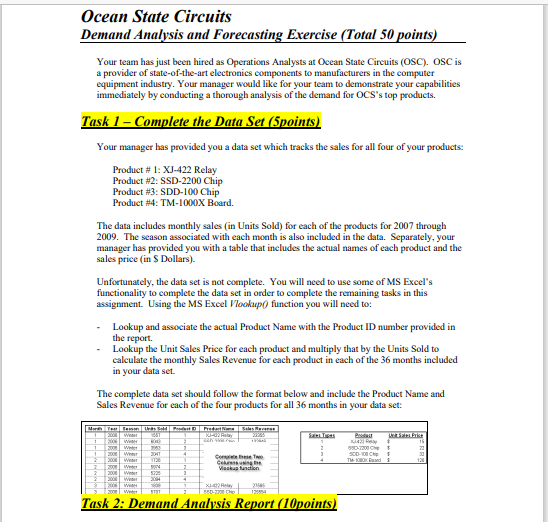
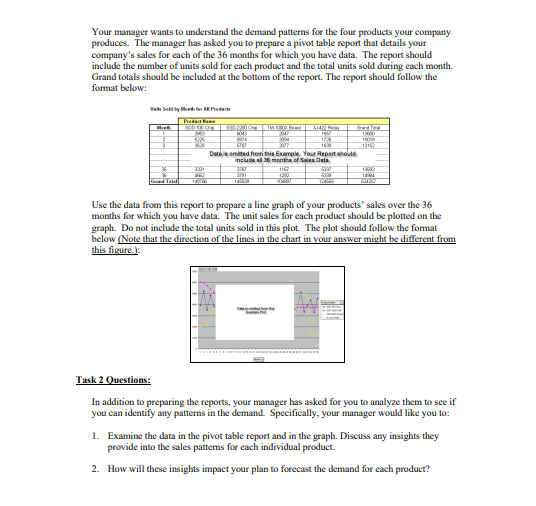
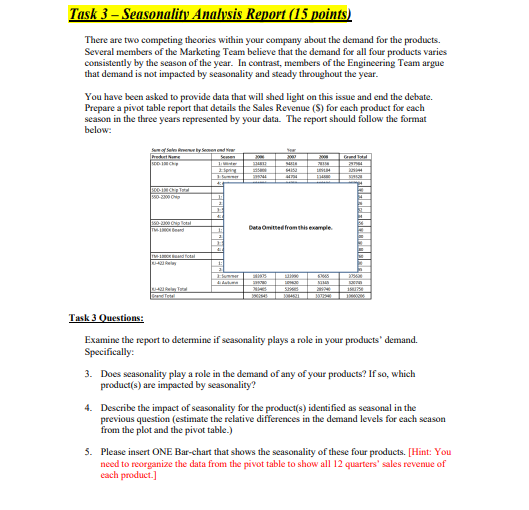
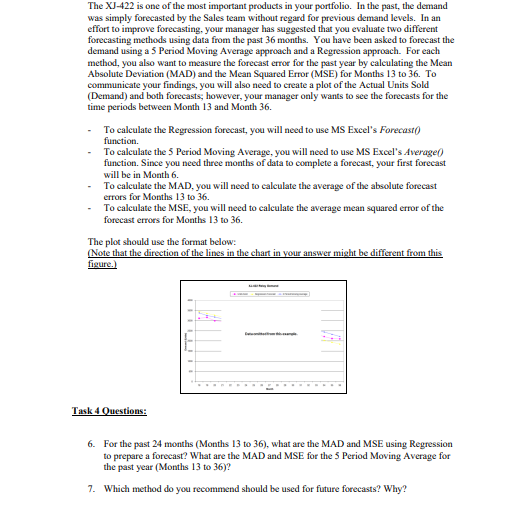
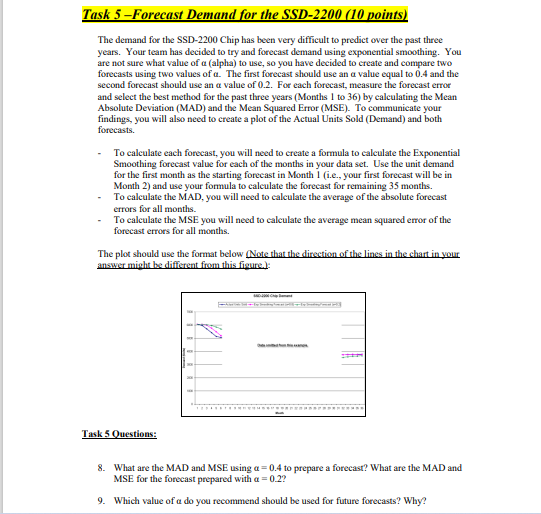
Ocean State Circuits Demand Analysis and Forecasting Exercise (Total 50 points) Your team has just been hired as Operations Analysts at Ocean State Circuits (OSC). OSC is a provider of state-of-the-art electronics components to manufacturers in the computer equipment industry. Your manager would like for your team to demonstrate your capabilities immediately by conducting a thorough analysis of the demand for OCS's top products. Task 1 - Complete the Data Set (5points) Your manager has provided you a data set which tracks the sales for all four of your products: Product # 1: XJ-422 Relay Product #2: SSD-2200 Chip Product #3: SDD-100 Chip Product #4: TM-1000X Board. The data includes monthly sales in Units Sold) for each of the products for 2007 through 2009. The season associated with each month is also included in the data. Separately, your manager has provided you with a table that includes the actual names of each product and the sales price in $ Dollars). Unfortunately, the data set is not complete. You will need to use some of MS Excel's functionality to complete the data set in order to complete the remaining tasks in this assignment. Using the MS Excel Vlookup() function you will need to: - Lookup and associate the actual Product Name with the Product ID number provided in the report. Lookup the Unit Sales Price for each product and multiply that by the Units Sold to calculate the monthly Sales Revenue for each product in each of the 36 months included in your data set. The complete data set should follow the format below and include the Product Name and Sales Revenue for each of the four products for all 36 months in your data set: 12 20 w 4 Mert Year Bands Best Practer Balas Berat W! W 200 w WT w Curs Viackag function 2008 Win W WEN 25 We HT 12 SO-Che $ TH-1000X 3 2 4 Task 2: Demand Analysis Report (10points) Your manager wants to understand the demand patterns for the four products your company produces. The manager has asked you to prepare a pivot table report that details your company's sales for each of the 36 months for which you have data. The report should include the number of units sold for each product and the total units sold during each month. Grand totals should be included at the bottom of the report. The report should follow the format below: ERO 3 33 ELOVI w 1992 18 14 6 119 Dat is omitted from this example. Your Report should include a 36 month of Sales Data ta 2 38 TO ded Use the data from this report to prepare a line graph of your products" sales over the 36 months for which you have data. The unit sales for each product should be plotted on the graph. Do not include the total units sold in this plot. The plot should follow the format below (Note that the direction of the lines in the chart in your answer might be different from this figure.) Task 2 Questions: In addition to preparing the reports, your manager has asked for you to analyze them to see if you can identify any patterns in the demand Specifically, your manager would like you to 1. Examine the data in the pivot table report and in the graph. Discuss any insights they provide into the sales pattems for each individual product. 2. How will these insights impact your plan to forecast the demand for each product? Task 3 - Seasonality Analysis Report (15 points) There are two competing theories within your company about the demand for the products. Several members of the Marketing Team believe that the demand for all four products varies consistently by the season of the year. In contrast, members of the Engineering Team argue that demand is not impacted by seasonality and steady throughout the year. You have been asked to provide data that will shed light on this issue and end the debate. Prepare a pivot table report that details the Sales Revenue (S) for each product for each season in the three years represented by your data. The report should follow the format below: Sumo LIH SO-300 IT Dulated from this example dal 1 Task 3 Questions: Examine the report to determine if seasonality plays a role in your products' demand. Specifically: 3. Does seasonality play a role in the demand of any of your products? If so, which product(s) are impacted by seasonality? 4. Describe the impact of seasonality for the product(s) identified as seasonal in the previous question (estimate the relative differences in the demand levels for each season from the plot and the pivot table.) 3. Please insert ONE Bar-chart that shows the seasonality of these four products. (Hint: You need to reorganize the data from the pivot table to show all 12 quarters' sales revenue of each product.] The XJ-422 is one of the most important products in your portfolio. In the past, the demand was simply forecasted by the Sales team without regard for previous demand levels. In an effort to improve forecasting, your manager has suggested that you evaluate two different forecasting methods using data from the past 36 months. You have been asked to forecast the demand using a 5 Period Moving Average approach and a Regression approach. For each method, you also want to measure the forecast error for the past year by calculating the Mean Absolute Deviation (MAD) and the Mean Squared Error (MSE) for Months 13 to 36. To communicate your findings, you will also need to create a plot of the Actual Units Sold (Demand) and both forecasts, however, your manager only wants to see the forecasts for the time periods between Month 13 and Month 36. To calculate the Regression forecast, you will need to use MS Excel's Forecast function. To calculate the 5 Period Moving Average, you will need to use MS Excel's Average/ function. Since you need three months of data to complete a forecast, your first forecast will be in Month 6. To calculate the MAD, you will need to calculate the average of the absolute forecast errors for Months 13 to 36. To calculate the MSE, you will need to calculate the average mean squared error of the forecast errors for Months 13 to 36. The plot should use the format below: (Note that the direction of the lines in the chart in your answer might be different from this figure.) Task 4 Questions: 6. For the past 24 months (Months 13 to 36), what are the MAD and MSE using Regression to prepare a forecast? What are the MAD and MSE for the Period Moving Average for the past year (Months 13 to 36)? 7. Which method do you recommend should be used for future forecasts? Why? Task 5 -Forecast Demand for the SSD-2200 (10 points) The demand for the SSD-2200 Chip has been very difficult to predict over the past three years. Your team has decided to try and forecast demand using exponential smoothing. You are not sure what value of a (alpha) to use, so you have decided to create and compare two forecasts using two values of a. The first forecast should use an a value equal to 0.4 and the second forecast should use an a value of 0.2. For each forecast, measure the forecast error and select the best method for the past three years (Months 1 to 36) by calculating the Mean Absolute Deviation (MAD) and the Mean Squared Error (MSE). To communicate your findings, you will also need to create a plot of the Actual Units Sold (Demand) and both forecasts. To calculate each forecast, you will need to create a formula to calculate the Exponential Smoothing forecast value for each of the months in your data set. Use the unit demand for the first month as the starting forecast in Month 1 (i.e., your first forecast will be in Month 2) and use your formula to calculate the forecast for remaining 35 months. To calculate the MAD, you will need to calculate the average of the absolute forecast errors for all months. To calculate the MSE you will need to calculate the average mean squared emor of the forecast errors for all months. The plot should use the format below (Note that the direction of the lines in the chart in your answer might be different from this figure. Task 5 Questions: 8. What are the MAD and MSE using a = 0.4 to prepare a forecast? What are the MAD and MSE for the forecast prepared with a = 0.2? 9. Which value of a do you recommend should be used for future forecasts? Why


