

Describe the structure of the data. Is it different than data you have examined before? Specifically,...
Fantastic news! We've Found the answer you've been seeking!
Question:
Transcribed Image Text:
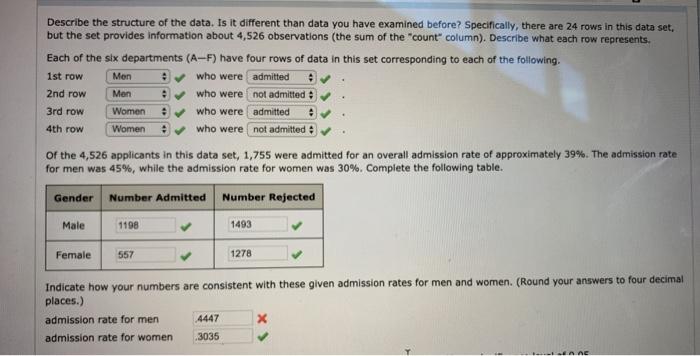
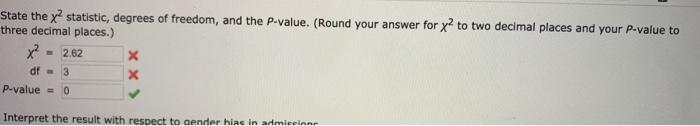
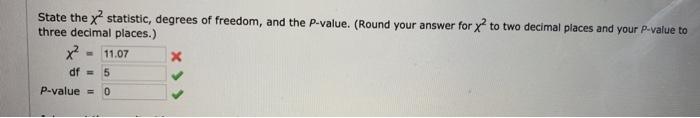
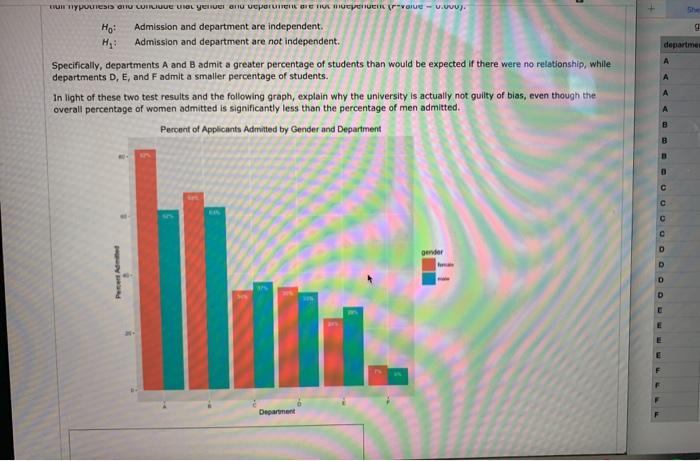
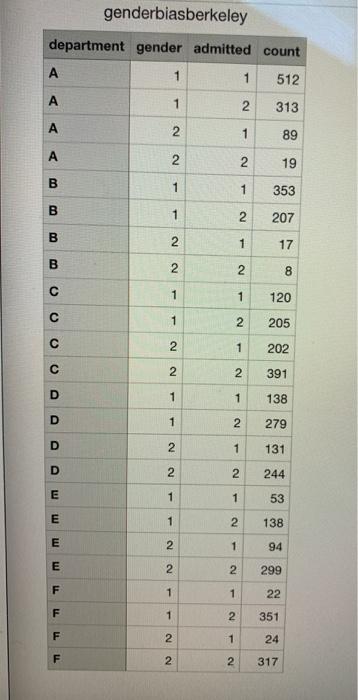
Describe the structure of the data. Is it different than data you have examined before? Specifically, there are 24 rows in this data set, but the set provides information about 4,526 observations (the sum of the "count" column). Describe what each row represents. Each of the six departments (A-F) have four rows of data in this set corresponding to each of the following. 1st row Men who were admitted 2nd row Men ✔ who were not admitted # admitted 3rd row Women ✔who were 4th row Women ✔who were not admitted # of the 4,526 applicants in this data set, 1,755 were admitted for an overall admission rate of approximately 39%. The admission rate for men was 45%, while the admission rate for women was 30%. Complete the following table. Gender Number Admitted Number Rejected Male 1198 1493 1278 Female 557 Indicate how your numbers are consistent with these given admission rates for men and women. (Round your answers to four decimal places.) admission rate for men 4447 x admission rate for women 3035 A DE State the x² statistic, degrees of freedom, and the P-value. (Round your answer for x² to two decimal places and your P-value to three decimal places.) x² 2.62 x x df 3 P-value = 0 Interpret the result with respect to gender hias in admiccione State the x² statistic, degrees of freedom, and the P-value. (Round your answer for x2 to two decimal places and your P-value to three decimal places.). x² 11.07 x df = 5 P-value = 0 mun hypothesis and continue that gender and department is not intende (value.www. Ho: Admission and department are independent. Admission and department are not independent. H₂: Specifically, departments A and B admit a greater percentage of students than would be expected if there were no relationship, while departments D, E, and F admit a smaller percentage of students. In light of these two test results and the following graph, explain why the university is actually not guilty of bias, even though the overall percentage of women admitted is significantly less than the percentage of men admitted. Percent of Applicants Admitted by Gender and Department gender Department Peter Admitted She g departmen OOOOOOOOL D genderbiasberkeley department gender admitted count A 1 1 512 A 2 313 A 2 1 89 A 2 2 19 B 1 1 353 B 1 2 207 B 2 1 17 2 2 8 1 120 2 205 1 202 2 391 1 138 2 279 1 131 244 1 53 2 138 1 94 2 299 1 22 2 351 1 24 2 317 B C C C D D D E E E E F F F LL LL 1 1 2 2 1 1 2 2 1 1 2 2 1 1 2 2 12 Describe the structure of the data. Is it different than data you have examined before? Specifically, there are 24 rows in this data set, but the set provides information about 4,526 observations (the sum of the "count" column). Describe what each row represents. Each of the six departments (A-F) have four rows of data in this set corresponding to each of the following. 1st row Men who were admitted 2nd row Men ✔ who were not admitted # admitted 3rd row Women ✔who were 4th row Women ✔who were not admitted # of the 4,526 applicants in this data set, 1,755 were admitted for an overall admission rate of approximately 39%. The admission rate for men was 45%, while the admission rate for women was 30%. Complete the following table. Gender Number Admitted Number Rejected Male 1198 1493 1278 Female 557 Indicate how your numbers are consistent with these given admission rates for men and women. (Round your answers to four decimal places.) admission rate for men 4447 x admission rate for women 3035 A DE State the x² statistic, degrees of freedom, and the P-value. (Round your answer for x² to two decimal places and your P-value to three decimal places.) x² 2.62 x x df 3 P-value = 0 Interpret the result with respect to gender hias in admiccione State the x² statistic, degrees of freedom, and the P-value. (Round your answer for x2 to two decimal places and your P-value to three decimal places.). x² 11.07 x df = 5 P-value = 0 mun hypothesis and continue that gender and department is not intende (value.www. Ho: Admission and department are independent. Admission and department are not independent. H₂: Specifically, departments A and B admit a greater percentage of students than would be expected if there were no relationship, while departments D, E, and F admit a smaller percentage of students. In light of these two test results and the following graph, explain why the university is actually not guilty of bias, even though the overall percentage of women admitted is significantly less than the percentage of men admitted. Percent of Applicants Admitted by Gender and Department gender Department Peter Admitted She g departmen OOOOOOOOL D genderbiasberkeley department gender admitted count A 1 1 512 A 2 313 A 2 1 89 A 2 2 19 B 1 1 353 B 1 2 207 B 2 1 17 2 2 8 1 120 2 205 1 202 2 391 1 138 2 279 1 131 244 1 53 2 138 1 94 2 299 1 22 2 351 1 24 2 317 B C C C D D D E E E E F F F LL LL 1 1 2 2 1 1 2 2 1 1 2 2 1 1 2 2 12
Expert Answer:

Related Book For 

Posted Date:
Students also viewed these accounting questions
-
Under which conditions due you maximize the multiplier to infinity 3
-
The individuals in this data set are a. Households. b. People. c. Adults. d. 120 variables. e. Columns. At the Census Bureau website www.census.gov, you can view detailed data collected by the...
-
In 2012, 709 women and 586 men were asked how much confidence they had in Congress. The results of the survey are de- scribed by the multiple bar graph in Fig. 18. a. Which gender of those surveyed...
-
Evaluate the binomial coefficient. 8.
-
Consider the diffuser of a supersonic aircraft flying atM = 1.4at such an altitude that the temperature is -20C, and the atmospheric pressure is 50 kPa. Consider two possible ways in which the...
-
1. In what way is Warren Buffetts plan the equivalent of a tariff? What would be its likely impact on American consumers? 2. What would be the likely effect of Mr. Buffetts plan on U.S. exports? 3....
-
True or False: If MARR \(=10 \%\) and IRR \(=9 \%\), then ERR \( <10 \%\) and \(\mathrm{PW}>\$ 0\).
-
Doyle Company issued $500,000 of 10-year, 7 percent bonds on January 1, 2016. The bonds were issued at face value. Interest is payable in cash on December 31 of each year. Doyle immediately invested...
-
Table 17-4 Features of alternative security issues Common Stock Preferred Stock Bonds 1.Ownership and control of the firm Belongs to common stockholders through voting rights and residual claim to...
-
Three-Month Project NOTE! Templates needed Ampersand, Inc., is a small business that operates in Somerset, VT The company is located at 732 Appalachian Way, Somerset, VT 05363. Its federal Employer...
-
The Assembling Department of Mat Liners had 10,000 units in process in December beginning and received 30,000 units from the Sewing Department. During the month, it completed 20,000 units and...
-
Material of Packages Catagories: 1. Paper and Cardboard 2. Glass 3. Plastic 4. Metal (tin or aluminum) 5. Flexible Foils (chip bags, cracker bags) 6. Typewriters 7. Plastic Coated Cardboard (juice...
-
STARNDARD COST CARD material 6kg @1,500 per kg , direct labour 5hr@20,000Tsh per hour, Overhead: variable 5hr@7000 per hour, Fixed 5hrs @ 9000 per hr 2.actual data october 2019 output 990 units ,...
-
Given the selected information of Thai Union PCL. Estimate the company's WACC. Table 1: Liabilities and Shareholder's Equity of Thai Union PCL. CURRENT LIABILITIES Bank overdrafts and short-term loan...
-
Juniper Enterprises sells handmade clocks. Its variable cost per clock is $8.50, and each clock sells for $17.00. The companys fixed costs total $10,328. Suppose that Juniper raises its price by 40...
-
Product Name: Choco Bliss Manufacturer: twinkies Year of Discontinuance: 1980s 1.What would be the Target Market? (5 marks) 2.4 P's (10 marks) 3.SWOT & PESTEL-C (10 + 20 = 30 marks) (NO...
-
What dominant cultural norms indefensible undermine cosmopolitan and human obligation? What dominant cultural norms undermine our understanding of our interdependence with one another and the ecology...
-
In Exercises 1-2, rewrite each verbal statement as an equation. Then decide whether the statement is true or false. Justify your answer. 1. The logarithm of the difference of two numbers is equal to...
-
When modeling some data with an exponential regression curve, explain how to determine whether a data point is an influential point. Compare this process with modeling some data with a regression...
-
The percentages of Americans who say there should be a ban on the possession of handguns are shown in Table 51 for various years. Let p be the percentage of Americans who say there should be a ban on...
-
(2, 5) and (3, 10) Find an approximate equation y = abx of the exponential curve that contains the given pair of points. Round the values of a and b to two decimal places.
-
Company data for dividend per share (DPS), earnings per share (EPS), share price, and price-to-earnings ratio (P/E) for the most recent five years are presented in Exhibit 10-9. In addition,...
-
The best model to use when valuing a young dividend-paying company that is just entering the growth phase is most likely the: A. Gordon growth model. B. Two-stage dividend discount model. C....
-
For the next three years, the annual dividends of a stock are expected to be 2.00, 2.10, and 2.20. The stock price is expected to be h20.00 at the end of three years. If the required rate of return...

Study smarter with the SolutionInn App