

Question: Okay I got this far I need help with everything under the title: The Line Of Best Fit I tried and I don't think it's
Okay I got this far I need help with everything under the title: The Line Of Best Fit I tried and I don't think it's right
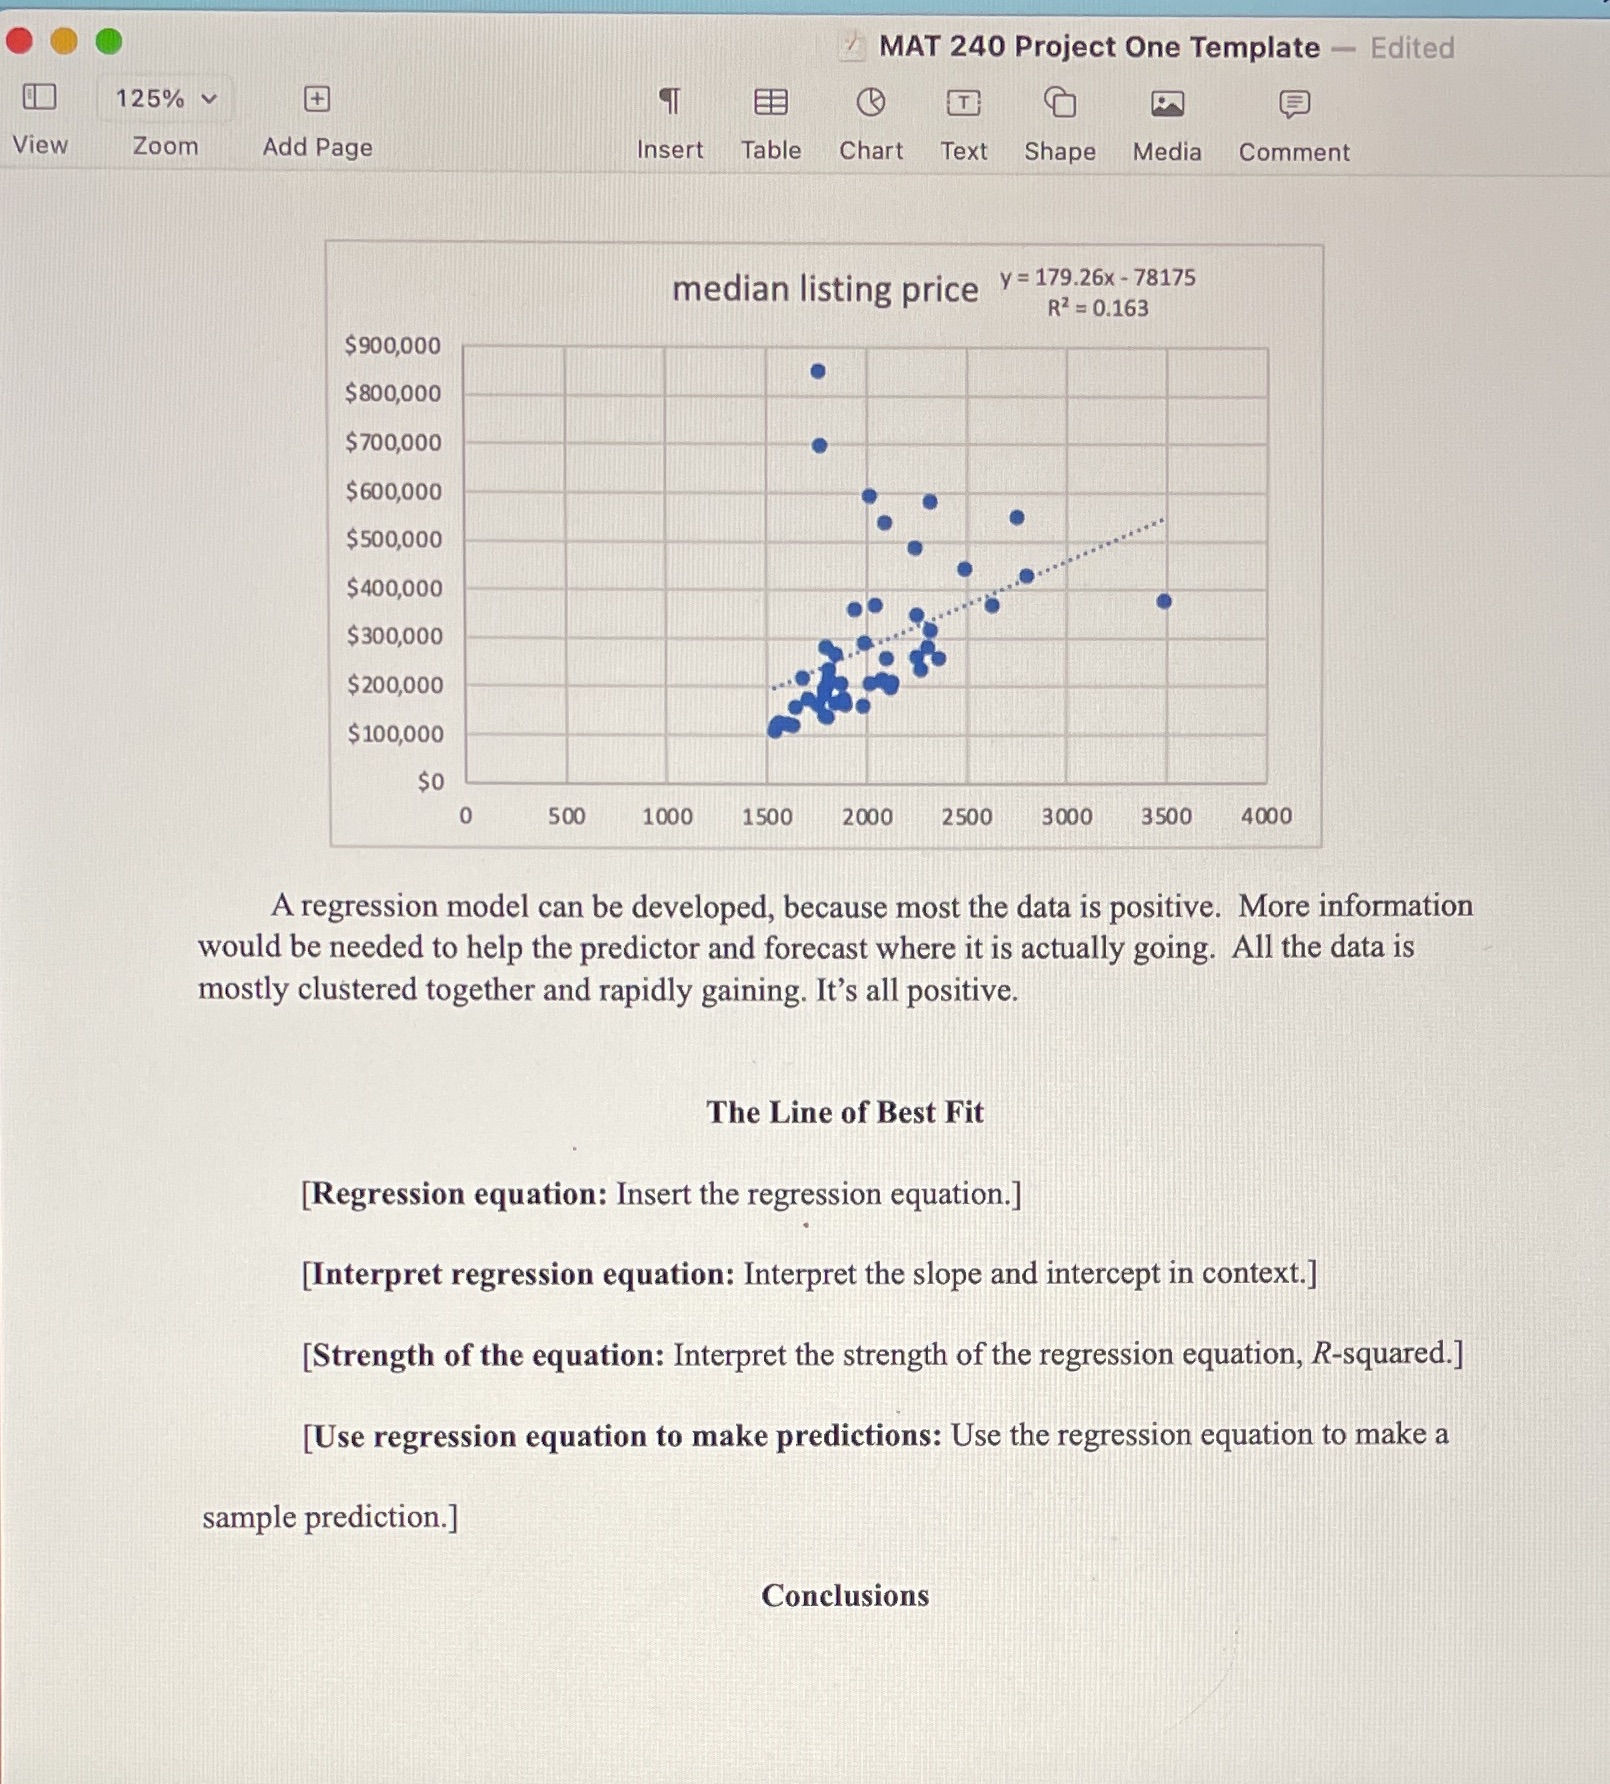
.. MAT 240 Project One Template - Edited 125% v + View Zoom Add Page Insert Table Chart Text Shape Media Comment median listing price y=179.26x - 78175 R2 = 0.163 $900,000 $800,000 $ 700,000 $600,000 $ 500,000 $400,000 $ 300,000 $200,000 $ 100,000 SO 500 1000 1500 2000 2500 3000 3500 400 0 A regression model can be developed, because most the data is positive. More information would be needed to help the predictor and forecast where it is actually going. All the data is mostly clustered together and rapidly gaining. It's all positive. The Line of Best Fit [Regression equation: Insert the regression equation.] [Interpret regression equation: Interpret the slope and intercept in context. ] [Strength of the equation: Interpret the strength of the regression equation, R-squared.] [Use regression equation to make predictions: Use the regression equation to make a sample prediction.] Conclusions
Step by Step Solution
There are 3 Steps involved in it

Get step-by-step solutions from verified subject matter experts