

Question: Old MathJax webview Complete the Actual 2012 column by calculating the respective values. Financial statement analysis The financial statements of Zach Industries for the year
Old MathJax webview
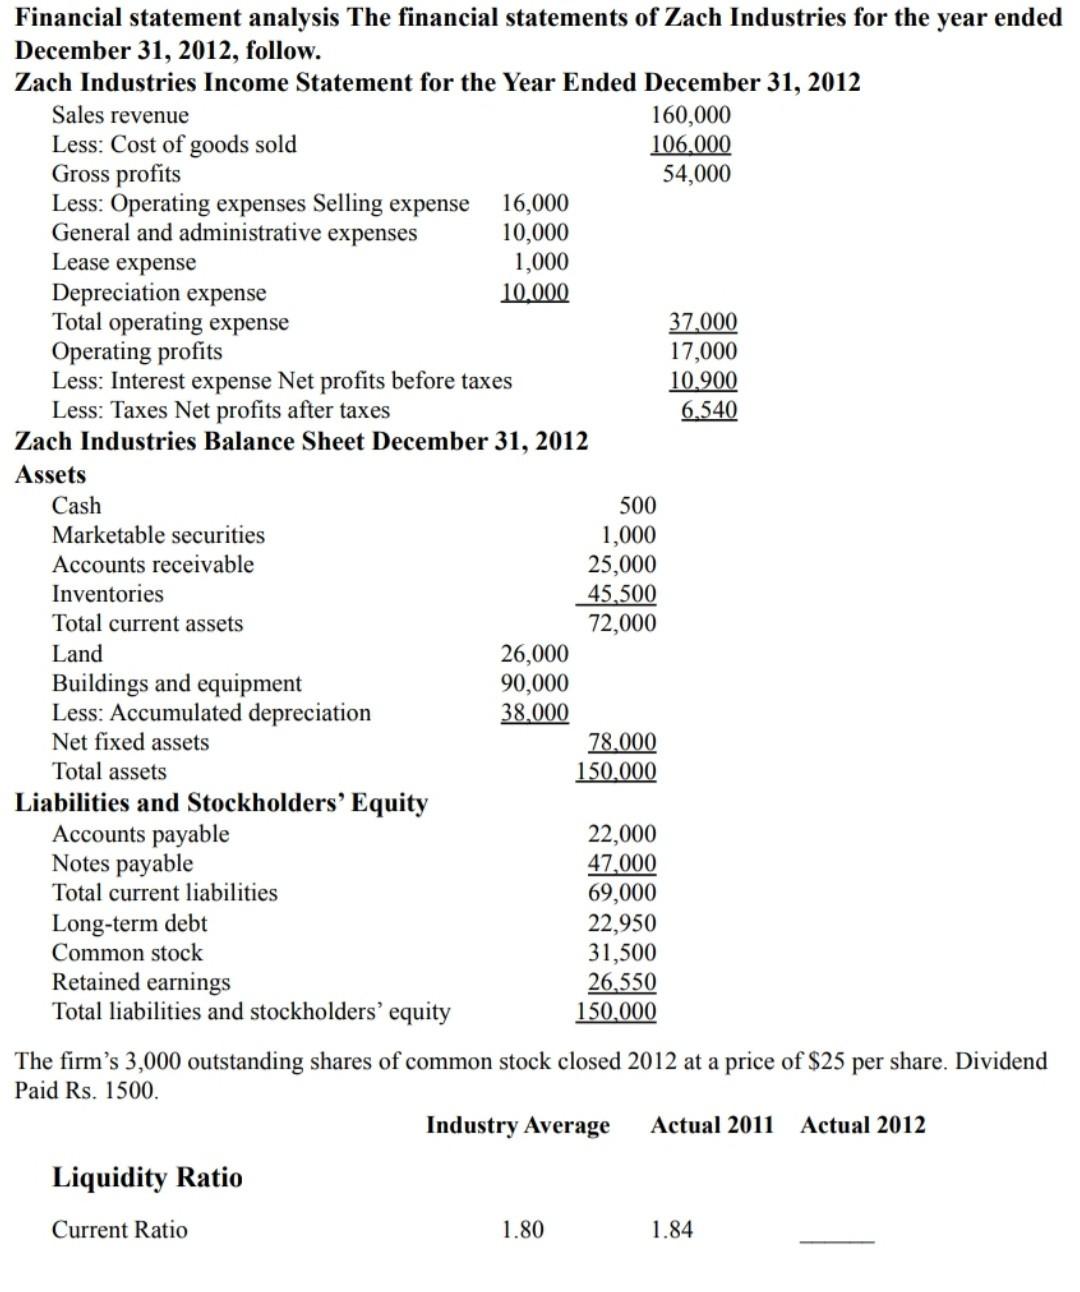
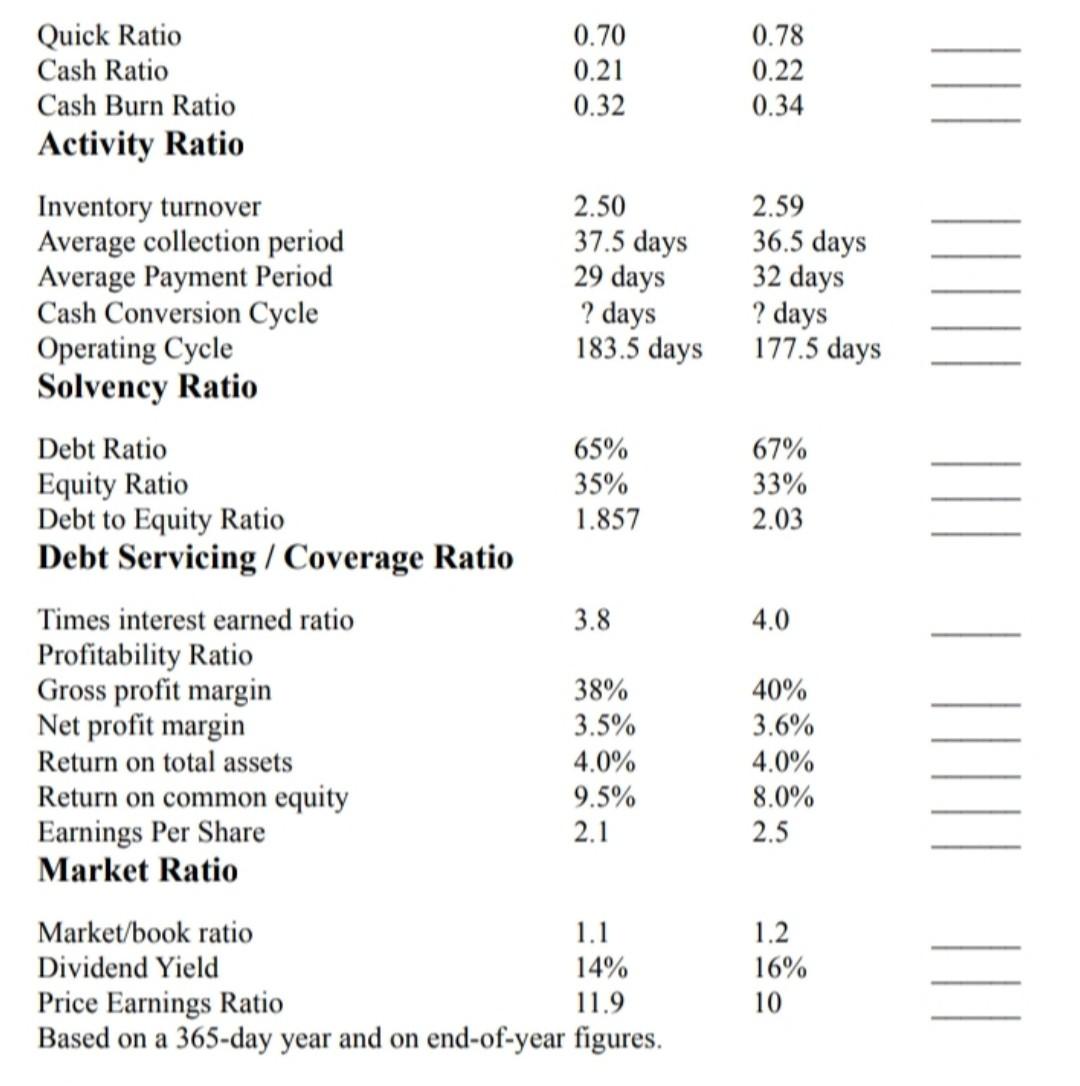
Complete the Actual 2012 column by calculating the respective values.
Financial statement analysis The financial statements of Zach Industries for the year ended December 31, 2012, follow.
Financial statement analysis The financial statements of Zach Industries for the year ended December 31, 2012, follow. Zach Industries Income Statement for the Year Ended December 31, 2012 Sales revenue 160,000 Less: Cost of goods sold 106,000 Gross profits 54,000 Less: Operating expenses Selling expense 16,000 General and administrative expenses 10,000 Lease expense 1,000 Depreciation expense 10.000 Total operating expense 37,000 Operating profits 17,000 Less: Interest expense Net profits before taxes 10.900 Less: Taxes Net profits after taxes 6.540 Zach Industries Balance Sheet December 31, 2012 Assets Cash 500 Marketable securities 1,000 Accounts receivable 25,000 Inventories 45,500 Total current assets 72,000 Land 26,000 Buildings and equipment 90,000 Less: Accumulated depreciation 38,000 Net fixed assets 78.000 Total assets 150.000 Liabilities and Stockholders' Equity Accounts payable 22,000 Notes payable 47,000 Total current liabilities 69,000 Long-term debt 22,950 Common stock 31,500 Retained earnings 26,550 Total liabilities and stockholders' equity 150.000 The firm's 3,000 outstanding shares of common stock closed 2012 at a price of $25 per share. Dividend Paid Rs. 1500. Industry Average Actual 2011 Actual 2012 Liquidity Ratio Current Ratio 1.80 1.84 Quick Ratio Cash Ratio Cash Burn Ratio Activity Ratio 0.70 0.21 0.32 0.78 0.22 0.34 2.50 37.5 days 29 days ? days 183.5 days 2.59 36.5 days 32 days ? days 177.5 days 65% 35% 1.857 67% 33% 2.03 Inventory turnover Average collection period Average Payment Period Cash Conversion Cycle Operating Cycle Solvency Ratio Debt Ratio Equity Ratio Debt to Equity Ratio Debt Servicing / Coverage Ratio Times interest earned ratio Profitability Ratio Gross profit margin Net profit margin Return on total assets Return on common equity Earnings Per Share Market Ratio 3.8 4.0 38% 3.5% 4.0% 9.5% 2.1 40% 3.6% 4.0% 8.0% 2.5 Market/book ratio 1.1 Dividend Yield 14% Price Earnings Ratio 11.9 Based on a 365-day year and on end-of-year figures. 1.2 16% 10 Financial statement analysis The financial statements of Zach Industries for the year ended December 31, 2012, follow. Zach Industries Income Statement for the Year Ended December 31, 2012 Sales revenue 160,000 Less: Cost of goods sold 106,000 Gross profits 54,000 Less: Operating expenses Selling expense 16,000 General and administrative expenses 10,000 Lease expense 1,000 Depreciation expense 10.000 Total operating expense 37,000 Operating profits 17,000 Less: Interest expense Net profits before taxes 10.900 Less: Taxes Net profits after taxes 6.540 Zach Industries Balance Sheet December 31, 2012 Assets Cash 500 Marketable securities 1,000 Accounts receivable 25,000 Inventories 45,500 Total current assets 72,000 Land 26,000 Buildings and equipment 90,000 Less: Accumulated depreciation 38,000 Net fixed assets 78.000 Total assets 150.000 Liabilities and Stockholders' Equity Accounts payable 22,000 Notes payable 47,000 Total current liabilities 69,000 Long-term debt 22,950 Common stock 31,500 Retained earnings 26,550 Total liabilities and stockholders' equity 150.000 The firm's 3,000 outstanding shares of common stock closed 2012 at a price of $25 per share. Dividend Paid Rs. 1500. Industry Average Actual 2011 Actual 2012 Liquidity Ratio Current Ratio 1.80 1.84 Quick Ratio Cash Ratio Cash Burn Ratio Activity Ratio 0.70 0.21 0.32 0.78 0.22 0.34 2.50 37.5 days 29 days ? days 183.5 days 2.59 36.5 days 32 days ? days 177.5 days 65% 35% 1.857 67% 33% 2.03 Inventory turnover Average collection period Average Payment Period Cash Conversion Cycle Operating Cycle Solvency Ratio Debt Ratio Equity Ratio Debt to Equity Ratio Debt Servicing / Coverage Ratio Times interest earned ratio Profitability Ratio Gross profit margin Net profit margin Return on total assets Return on common equity Earnings Per Share Market Ratio 3.8 4.0 38% 3.5% 4.0% 9.5% 2.1 40% 3.6% 4.0% 8.0% 2.5 Market/book ratio 1.1 Dividend Yield 14% Price Earnings Ratio 11.9 Based on a 365-day year and on end-of-year figures. 1.2 16% 10
Step by Step Solution
There are 3 Steps involved in it

Get step-by-step solutions from verified subject matter experts