

Question: Old MathJax webview excel please 1. as Assume that you expect that the average return on a security in various markets is shown in the
Old MathJax webview
excel please
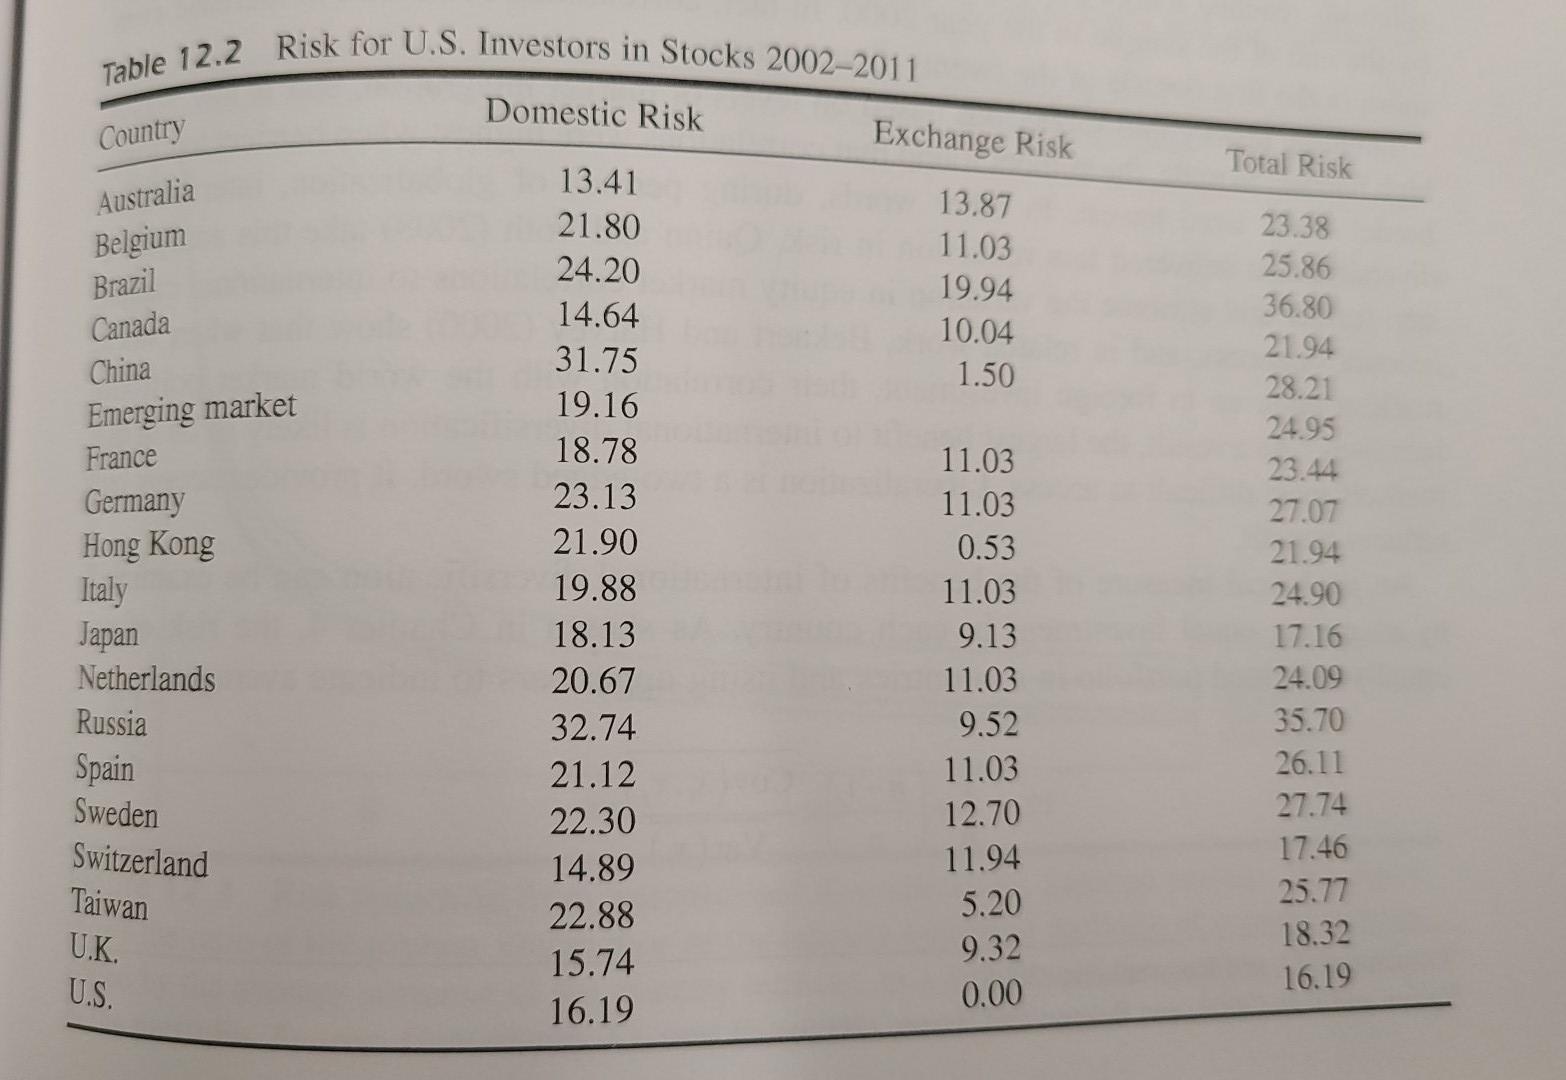
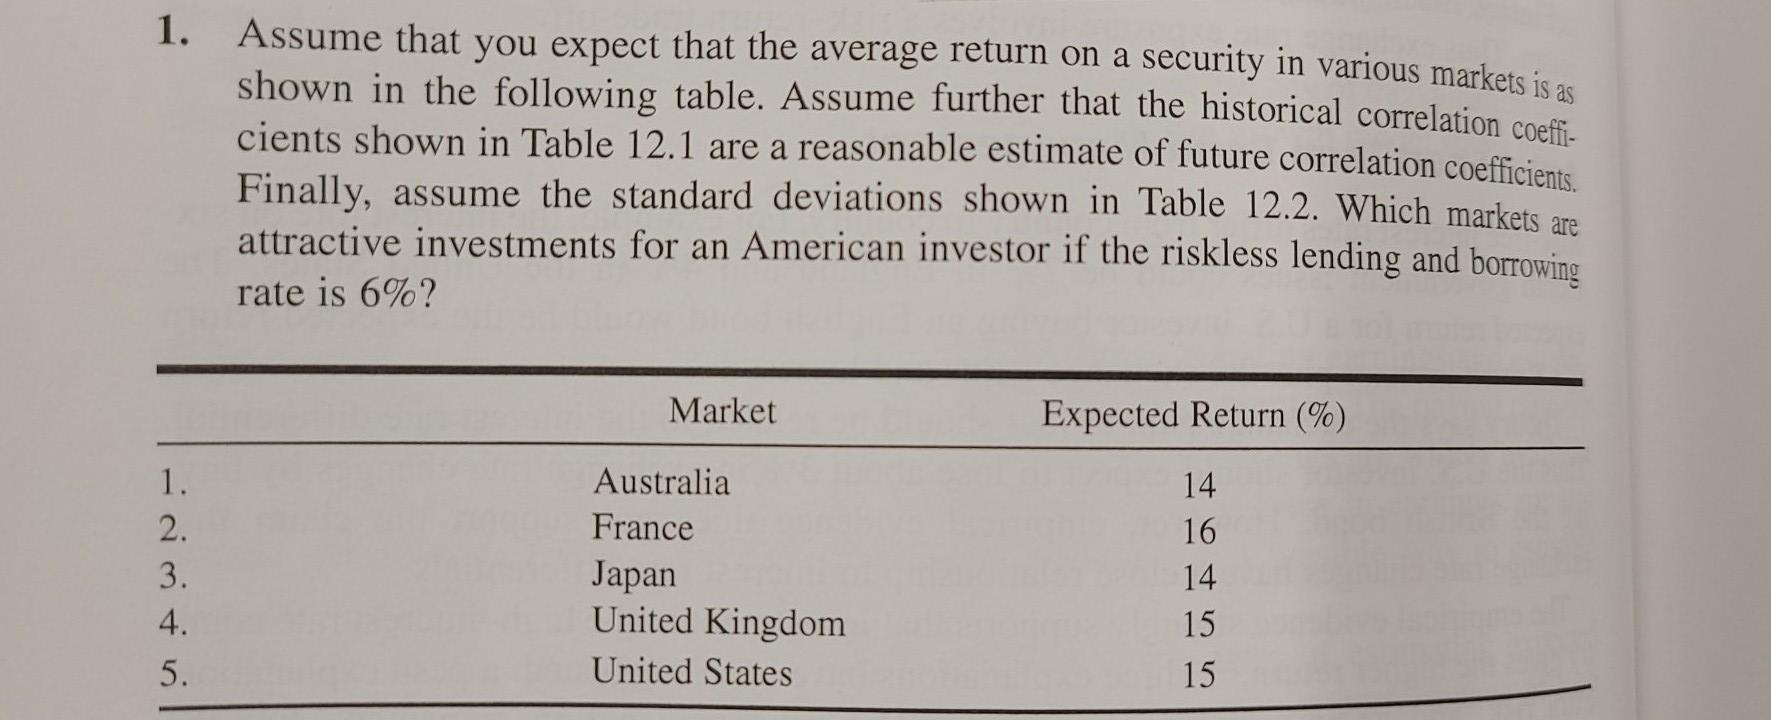
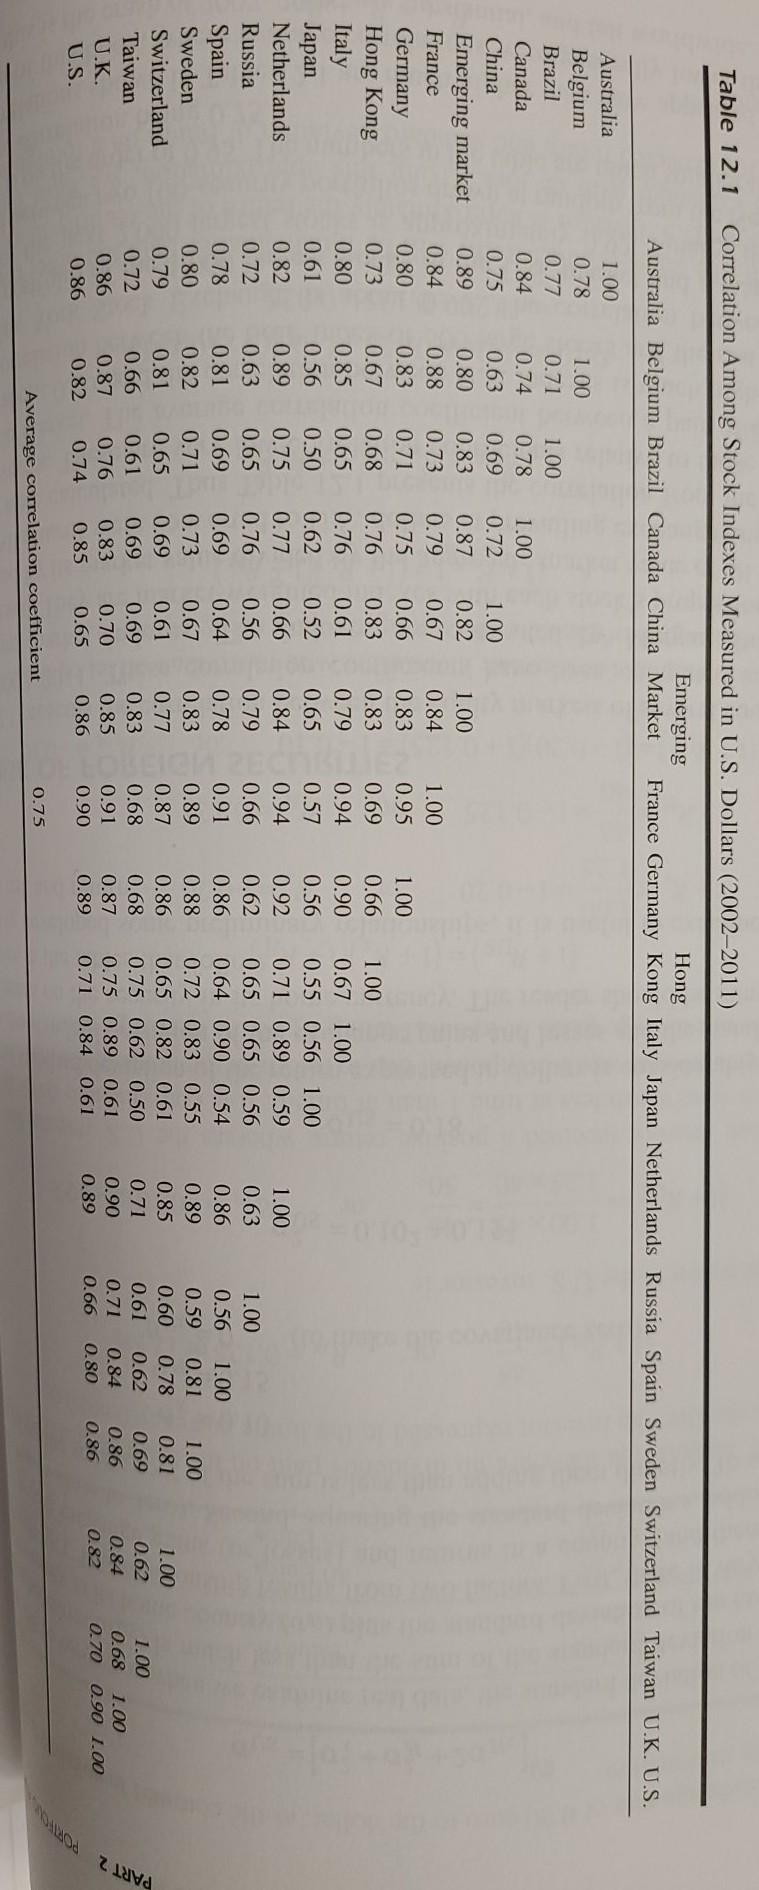
1. as Assume that you expect that the average return on a security in various markets is shown in the following table. Assume further that the historical correlation coeffi- cients shown in Table 12.1 are a reasonable estimate of future correlation coefficients. Finally, assume the standard deviations shown in Table 12.2. Which markets are attractive investments for an American investor if the riskless lending and borrowing rate is 6%? Market Expected Return (%) 1. 2. 3. 4. 5. Australia France Japan United Kingdom United States 14 16 14 15 15 Table 12.1 Correlation Among Stock Indexes Measured in U.S. Dollars (20022011) Emerging Australia Belgium Brazil Canada China Market Hong France Germany Kong Italy Japan Netherlands Russia Spain Sweden Switzerland Taiwan U.K. U.S. Australia Belgium Brazil Canada China Emerging market France Germany Hong Kong 1.00 0.66 Italy 1.00 0.78 0.77 0.84 0.75 0.89 0.84 0.80 0.73 0.80 0.61 0.82 0.72 0.78 0.80 0.79 0.72 0.86 0.86 0.90 1.00 0.71 0.74 0.63 0.80 0.88 0.83 0.67 0.85 0.56 0.89 0.63 0.81 0.82 0.81 0.66 0.87 0.82 1.00 0.78 0.69 0.83 0.73 0.71 0.68 0.65 0.50 0.75 0.65 0.69 0.71 0.65 0.61 0.76 0.74 Japan Netherlands Russia Spain Sweden Switzerland Taiwan U.K. U.S. 1.00 0.72 0.87 0.79 0.75 0.76 0.76 0.62 0.77 0.76 0.69 0.73 0.69 0.69 0.83 0.85 1.00 0.82 0.67 0.66 0.83 0.61 0.52 0.66 0.56 0.64 0.67 0.61 0.69 0.70 0.65 1.00 0.84 0.83 0.83 0.79 0.65 0.84 0.79 0.78 0.83 0.77 0.83 0.85 0.86 1.00 0.95 0.69 0.94 0.57 0.94 0.66 0.91 0.89 0.87 0.68 0.91 0.90 1.00 1.00 0.67 1.00 0.55 0.56 1.00 0.71 0.89 0.59 0.65 0.65 0.56 0.64 0.90 0.54 0.72 0.83 0.55 0.65 0.82 0.61 0.75 0.62 0.50 0.75 0.89 0.61 0.71 0.84 0.61 0.56 0.92 0.62 0.86 0.88 0.86 0.68 0.87 0.89 1.00 0.63 0.86 0.89 0.85 0.71 0.90 0.89 1.00 0.56 0.59 0.81 0.60 0.78 0.61 0.62 0.71 0.84 0.66 0.80 1.00 0.81 0.69 0.86 0.86 1.00 0.62 0.84 0.82 1.00 0.68 1.00 0.70 0.90 1.00 PART 2 0.75 Average correlation coefficient Table 12.2 Risk for U.S. Investors in Stocks 2002-2011 Domestic Risk Country Exchange Risk Total Risk Australia Belgium Brazil Canada China Emerging market 13.87 11.03 19.94 10.04 1.50 France Germany Hong Kong Italy Japan Netherlands Russia Spain Sweden 13.41 21.80 24.20 14.64 31.75 19.16 18.78 23.13 21.90 19.88 18.13 20.67 32.74 21.12 22.30 14.89 22.88 15.74 16.19 11.03 11.03 0.53 11.03 9.13 11.03 9.52 11.03 12.70 11.94 5.20 9.32 0.00 23.38 25.86 36.80 21.94 28.21 24.95 23.44 27.07 21.94 24.90 17.16 24.09 35.70 26.11 27.74 17.46 25.77 18.32 16.19 Switzerland Taiwan U.K. U.S. 1. as Assume that you expect that the average return on a security in various markets is shown in the following table. Assume further that the historical correlation coeffi- cients shown in Table 12.1 are a reasonable estimate of future correlation coefficients. Finally, assume the standard deviations shown in Table 12.2. Which markets are attractive investments for an American investor if the riskless lending and borrowing rate is 6%? Market Expected Return (%) 1. 2. 3. 4. 5. Australia France Japan United Kingdom United States 14 16 14 15 15 Table 12.1 Correlation Among Stock Indexes Measured in U.S. Dollars (20022011) Emerging Australia Belgium Brazil Canada China Market Hong France Germany Kong Italy Japan Netherlands Russia Spain Sweden Switzerland Taiwan U.K. U.S. Australia Belgium Brazil Canada China Emerging market France Germany Hong Kong 1.00 0.66 Italy 1.00 0.78 0.77 0.84 0.75 0.89 0.84 0.80 0.73 0.80 0.61 0.82 0.72 0.78 0.80 0.79 0.72 0.86 0.86 0.90 1.00 0.71 0.74 0.63 0.80 0.88 0.83 0.67 0.85 0.56 0.89 0.63 0.81 0.82 0.81 0.66 0.87 0.82 1.00 0.78 0.69 0.83 0.73 0.71 0.68 0.65 0.50 0.75 0.65 0.69 0.71 0.65 0.61 0.76 0.74 Japan Netherlands Russia Spain Sweden Switzerland Taiwan U.K. U.S. 1.00 0.72 0.87 0.79 0.75 0.76 0.76 0.62 0.77 0.76 0.69 0.73 0.69 0.69 0.83 0.85 1.00 0.82 0.67 0.66 0.83 0.61 0.52 0.66 0.56 0.64 0.67 0.61 0.69 0.70 0.65 1.00 0.84 0.83 0.83 0.79 0.65 0.84 0.79 0.78 0.83 0.77 0.83 0.85 0.86 1.00 0.95 0.69 0.94 0.57 0.94 0.66 0.91 0.89 0.87 0.68 0.91 0.90 1.00 1.00 0.67 1.00 0.55 0.56 1.00 0.71 0.89 0.59 0.65 0.65 0.56 0.64 0.90 0.54 0.72 0.83 0.55 0.65 0.82 0.61 0.75 0.62 0.50 0.75 0.89 0.61 0.71 0.84 0.61 0.56 0.92 0.62 0.86 0.88 0.86 0.68 0.87 0.89 1.00 0.63 0.86 0.89 0.85 0.71 0.90 0.89 1.00 0.56 0.59 0.81 0.60 0.78 0.61 0.62 0.71 0.84 0.66 0.80 1.00 0.81 0.69 0.86 0.86 1.00 0.62 0.84 0.82 1.00 0.68 1.00 0.70 0.90 1.00 PART 2 0.75 Average correlation coefficient Table 12.2 Risk for U.S. Investors in Stocks 2002-2011 Domestic Risk Country Exchange Risk Total Risk Australia Belgium Brazil Canada China Emerging market 13.87 11.03 19.94 10.04 1.50 France Germany Hong Kong Italy Japan Netherlands Russia Spain Sweden 13.41 21.80 24.20 14.64 31.75 19.16 18.78 23.13 21.90 19.88 18.13 20.67 32.74 21.12 22.30 14.89 22.88 15.74 16.19 11.03 11.03 0.53 11.03 9.13 11.03 9.52 11.03 12.70 11.94 5.20 9.32 0.00 23.38 25.86 36.80 21.94 28.21 24.95 23.44 27.07 21.94 24.90 17.16 24.09 35.70 26.11 27.74 17.46 25.77 18.32 16.19 Switzerland Taiwan U.K. U.S
Step by Step Solution
There are 3 Steps involved in it

Get step-by-step solutions from verified subject matter experts