

Question: Old MathJax webview give detailed conclusions . The main data is divided in two main tables training table with dataset consisting of 421 570 rows
Old MathJax webview
give detailed conclusions
.
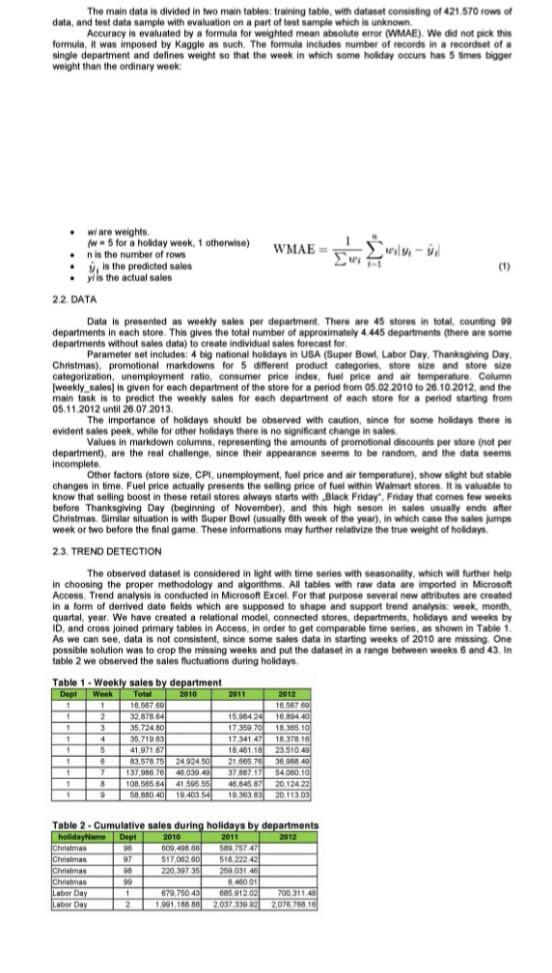
The main data is divided in two main tables training table with dataset consisting of 421 570 rows of data, and test data sample with evaluation on a part of test sample which is unknown Accuracy in evaluated by a formula for weighted mean absolute errot (WMAE) We did not pick this formula. It was imposed by Kaggle as such. The formula includes number of records in a recordset of a single department and defines weight so that the week in which some holiday occurs has 5 times bigger weight than the ordinary week WMAE wiare weights 5 for a holiday week, 1 otherwise) n is the number of rows is the predicted sales Wis the actual sales 22 DATA - (1) Data is presented as weekly sales per department. There are 45 stores in total, counting 09 departments in each store. This gives the total number of approximately 4.445 departments (there are some departments without sales data) to create individual sales forecast for Parameter set includes: 4 big national holidays in USA (Super Bowl Labor Day. Thanksgiving Day, Christmas), promotional markdowns for 5 different product categories, store size and store size categorization, unemployment ratio, consumer price index, fuel price and air temperature Column weekly sales is given for each department of the store for a period from 05.02.2010 to 26.10.2012, and the main task is to predict the weekly sales for each department of each store for a period starting from 05.11.2012 until 20.07.2013 The importance of holidays should be observed with caution since for some holidays there is evident sales peek, while for other holidays there is no significant change in sales Values in markdown columns, representing the amounts of promotional discounts per store not per department), are the real challenge, since their appearance seems to be random, and the data sem Incomplete Other factors (sforo size, CPI, unemployment, fuel price and air temperature), show slight but stable changes in time, Fuel price actually presents the selling price of fuel within Walmart stores. It is valuable to know that selling boost in these retail stores always starts with Black Friday, Friday that comes few weeks before Thanksgiving Day (beginning of November), and this high soson in sales usually ends after Christmas. Similar situation is with Super Bowl (usually oth week of the year), in which case the sales jumps week or two before the final game. These informations may further relativize the true weight of holidays 22. TREND DETECTION The observed dataset is considered in light with time series with seasonality, which will further help in choosing the proper methodology and algorithms. All tables with raw data are imported in Microsoft Access Trend analysis is conducted in Microsoft Excel. For that purpose several new attributes are created in a form of derrived date fields which are supposed to shape and support trend analysis week, month, quartal, year. We have created a relational model, connected stores, departments, holidays and weeks by ID, and cross joined primary tables in Access, in order to get comparable time series, as shown in Table 1 As we can see, data is not consistent, since some sales data in starting weeks of 2010 are missing. One possible solution was to crop the missing weeks and put the dataset in a range between weeks 6 and 43. In table 2 we observed the sales fluctuations during holidays Table 1. Weekly sales by department DepWeek Total T 2010 2011 2012 1 16 56700 18 56700 + 2 32.878764 15.06424 1640 1 3 35,72480 1735970 13 10 + 4 35.71063 173414 1837810 1 5 41.97167 18401 23 510.49 1 63,57875 2492490 21 50571 3640 7 137,08670 460300 378871 54610 1 1 108,505 64 41 505 55 48.865.87 20.12422 . 50,00 40 18403 1036383 30 113 03 Table 2. Cumulative sales during holidays by departments holidayate Dept 2010 2011 2012 China BE 502757247 97 517.00200 316 m2 Christmas 90 220307 35 250 03140 Christmas 90 1000 Labor Day 679.750.43 60591202 700311:40 Labor Day 2 11011000 2,037 31 207678878 ChristmasStep by Step Solution
There are 3 Steps involved in it
1 Expert Approved Answer
Step: 1 Unlock

Question Has Been Solved by an Expert!
Get step-by-step solutions from verified subject matter experts
Step: 2 Unlock
Step: 3 Unlock