

Question: Old MathJax webview Image Courtesy Google Maps ABC Logistics is a Toronto-based logistics company with customers in 5 key Southern Ontario markets, London, Kitchener, Milton,
Old MathJax webview
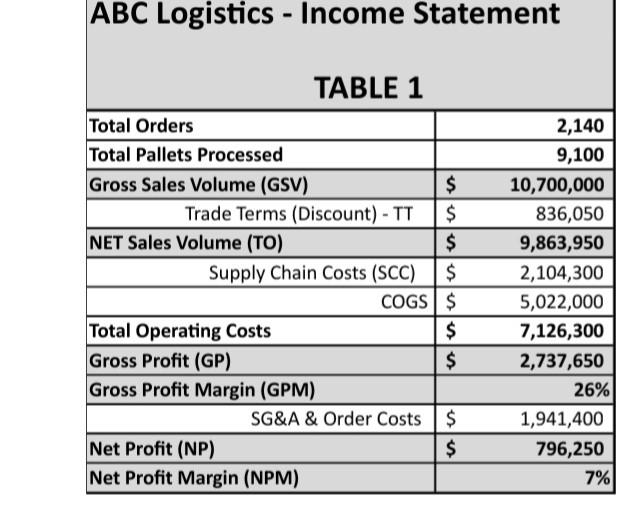
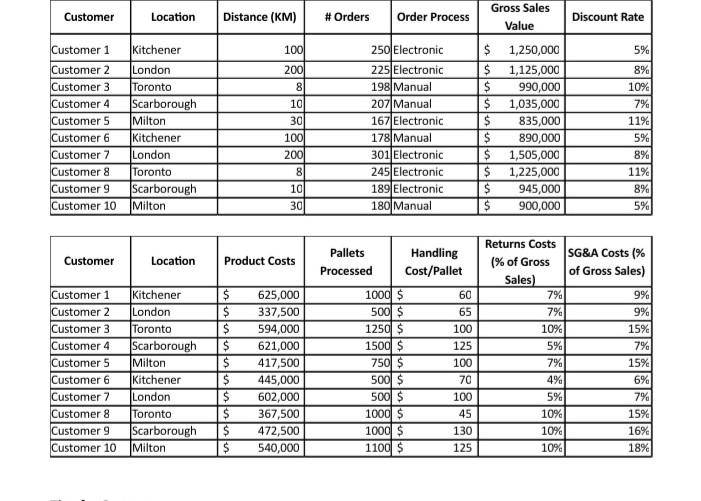
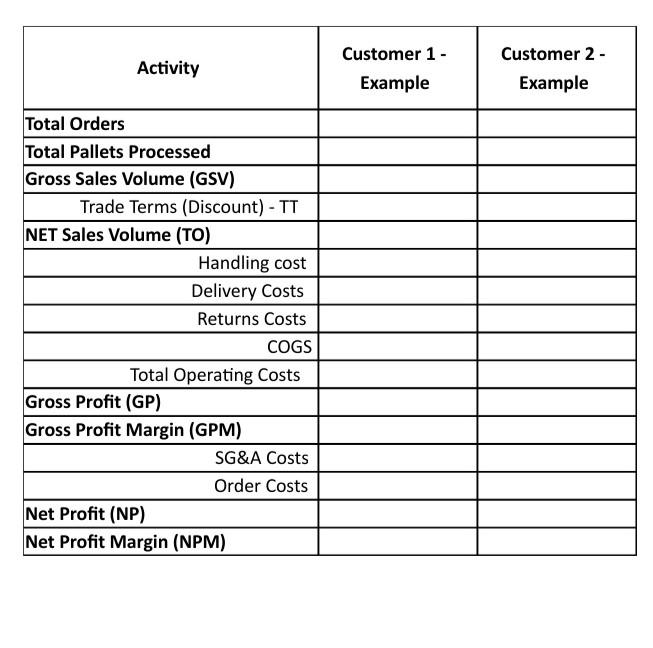
Image Courtesy Google Maps ABC Logistics is a Toronto-based logistics company with customers in 5 key Southern Ontario markets, London, Kitchener, Milton, Downtown Toronto and Scarborough. The CFO has just presented the companys financial report based on their SAP ERP system data. (Table 1 below). In addition, he is recommending that given customer trends in the nearby Scarborough Market they should focus on capturing the growth in this market and probably drop the London market given its distance away from the Toronto base. Build a Cost-To-Serve Analysis Table to compare each customer, using the additional Supply Chain operational data that has been sourced from ABCs WMS, TMS and Order Management System and answer the following questions. 1. Which customer is the HIGHEST PERFORMING Net Profit customer? 2. Which customer is the WORST PERFORMING Net Profit customer? 3. Which MARKET LOCATION is the HIGHEST PERFORMING Net Profit MARKET LOCATION? 4. Which MARKET LOCATION is the WORST PERFORMING Net Profit MARKET LOCATION? 5. Should ABC Logistics abandon the London Market? Provide data and supporting reasons to for your answer 6. Should ABC Expand into the Scarborough Market? Provide data and supporting reasons for your answer 7. Do you support a project to convert all customers to electronic ordering? Explain USE THE FOLLOWING ASSUMPTIONS AND WMS, TMS, Order Management system additional data ASSUMPTIONS 1. Delivery Cost = $1.00 per pallet per KM 2. Ordering Cost a. $250 per Electronic order b. $500 per manual order Tips for Success Use the cover page as provided with the Assignment for submission. Consider this to be formal proposal submitted to your organization. Use the following template for your Cost-To-Serve Comparison (2 customers shown as an example only)
i attached all pictures of table at the end. please check it.
ABC Logistics - Income Statement TABLE 1 2,140 9,100 10,700,000 836,050 9,863,950 2,104,300 Total Orders Total Pallets Processed Gross Sales Volume (GSV) $ Trade Terms (Discount) - TT $ NET Sales Volume (TO) $ Supply Chain Costs (SCC) $ COGS $ Total Operating Costs $ Gross Profit (GP) $ Gross Profit Margin (GPM) SG&A & Order Costs $ Net Profit (NP) $ Net Profit Margin (NPM) 5,022,000 7,126,300 2,737,650 26% 1,941,400 796,250 7% Gross Sales Customer Location Distance (KM) # Orders Order Process Discount Rate Value Customer 1 1001 5% 2001 8% 8 10% 10 7% 11% Customer 2 Customer 3 Customer 4 Customer 5 Customer 6 Customer 7 Customer & Customer 9 Customer 10 Kitchener London Toronto Scarborough Milton Kitchener London Toronto Scarborough Milton 30 100 2001 250 Electronic 225 Electronic 198 Manual 207 Manual 167 Electronic 178 Manual 301 Electronic 245 Electronic 189 Electronic 180 Manual $ 1,250,000 $ 1,125,000 $ 990,000 $ 1,035,000 $ 835,000 $ 890,000 $ 1,505,000 $ 1,225,000 $ 945,000 $ 900,000 5% 8 8% 11% 8% 10 30 5% Pallets Customer Location Product Costs Handling Cost/Pallet Processed 60 65 100 125 Customer 1 Kitchener Customer 2 London Customer 3 Toronto Customer 4 Scarborough Customer 5 Milton Customer 6 Kitchener Customer 7 London Customer 8 Toronto Customer 9 Scarborough Customer 10 Milton 100 Returns Costs SG&A Costs % (% of Gross of Gross Sales) Sales) 7% 9% 7% 9% 10% 15% 5% 7% 7% 15% 49 6% $ $ $ $ $ $ $ $ $ $ 625,000 337,500 594,000 621,000 417,500 445,000 602,000 367,500 472,500 540,000 1000 $ 500 $ 1250 $ 1500 $ 750 $ 500 $ 500 $ 1000 $ 1000 $ 1100 $ 70 100 5% 7% 45 15% 130 10% 10% 10% 16% 125 18% Customer 1 - Customer 2- Activity Example Example Total Orders Total Pallets Processed Gross Sales Volume (GSV) Trade Terms (Discount) - TT NET Sales Volume (TO) Handling cost Delivery Costs Returns Costs COGS Total Operating Costs Gross Profit (GP) Gross Profit Margin (GPM) SG&A Costs Order Costs Net Profit (NP) Net Profit Margin (NPM)
Step by Step Solution
There are 3 Steps involved in it

Get step-by-step solutions from verified subject matter experts