

Question: Old MathJax webview please forward my question in operation management thank you The preceding presentation of the regression equation and variable definition provides a good
Old MathJax webview
please forward my question in operation management thank you
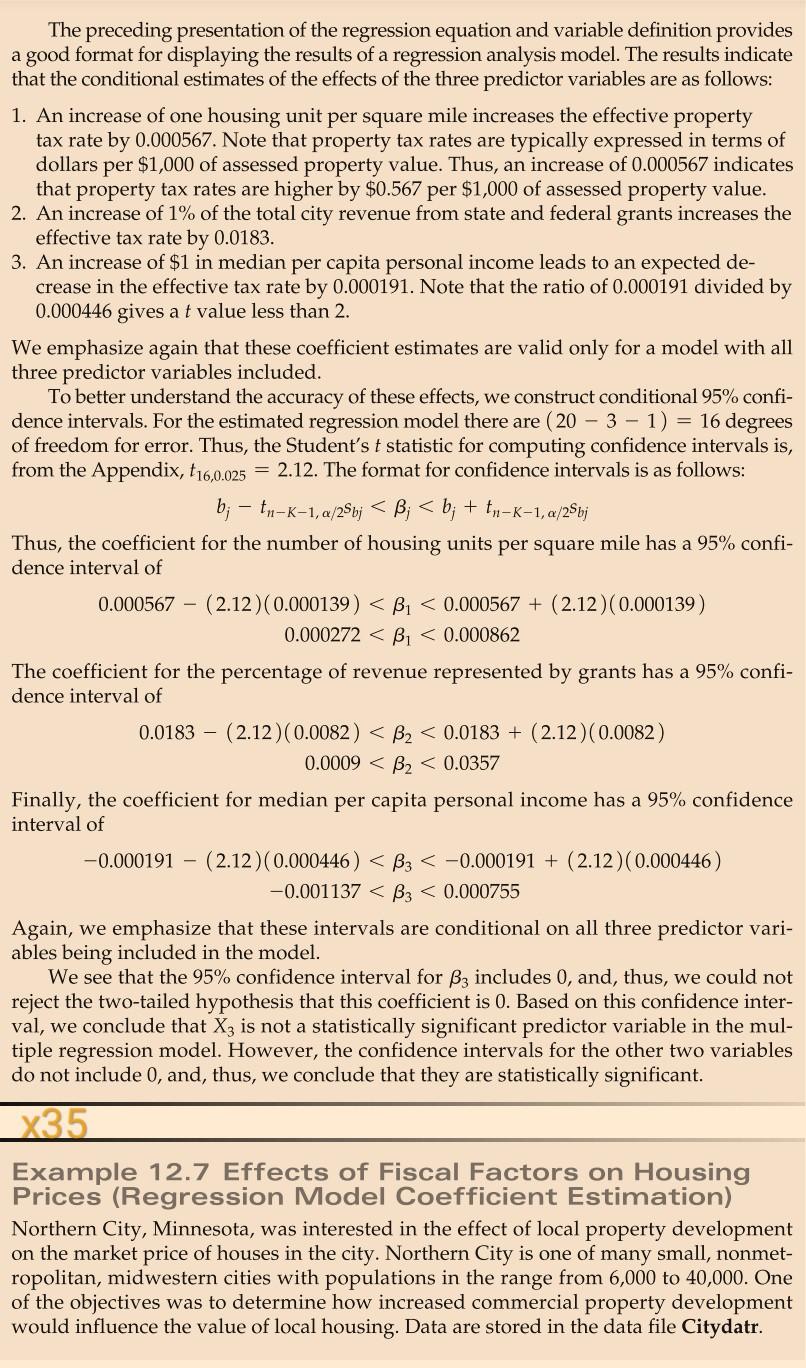
The preceding presentation of the regression equation and variable definition provides a good format for displaying the results of a regression analysis model. The results indicate that the conditional estimates of the effects of the three predictor variables are as follows: 1. An increase of one housing unit per square mile increases the effective property tax rate by 0.000567. Note that property tax rates are typically expressed in terms of dollars per $1,000 of assessed property value. Thus, an increase of 0.000567 indicates that property tax rates are higher by $0.567 per $1,000 of assessed property value. 2. An increase of 1% of the total city revenue from state and federal grants increases the effective tax rate by 0.0183. 3. An increase of $1 in median per capita personal income leads to an expected de- crease in the effective tax rate by 0.000191. Note that the ratio of 0.000191 divided by 0.000446 gives a t value less than 2. We emphasize again that these coefficient estimates are valid only for a model with all three predictor variables included. To better understand the accuracy of these effects, we construct conditional 95% confi- dence intervals. For the estimated regression model there are ( 20 - 3 - 1) = 16 degrees of freedom for error. Thus, the Student's t statistic for computing confidence intervals is, from the Appendix, 116,0.025 = 2.12. The format for confidence intervals is as follows: b; -tn-K-1, a/2Sb; bj Thus, the coefficient for the number of housing units per square mile has a 95% confi- dence interval of 0.000567 - (2.12)(0.000139)Step by Step Solution
There are 3 Steps involved in it
1 Expert Approved Answer
Step: 1 Unlock

Question Has Been Solved by an Expert!
Get step-by-step solutions from verified subject matter experts
Step: 2 Unlock
Step: 3 Unlock