

Question: Old MathJax webview Solve in excel: Curve Fitting with Constraints.Abanks economist has been interested in developing a production function for the bank. The model recognizes
Old MathJax webview
Solve in excel:
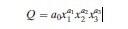
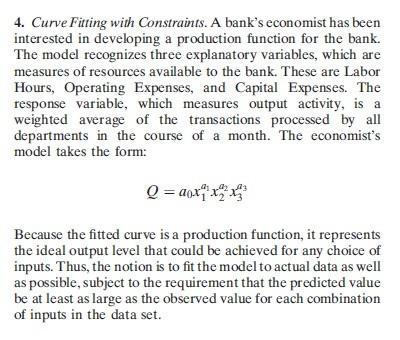
Curve Fitting with Constraints.Abanks economist has been interested in developing a production function for the bank. The model recognizes three explanatory variables, which are measures of resources available to the bank. These are Labor Hours, Operating Expenses, and Capital Expenses. The response variable, which measures output activity, is a weighted average of the transactions processed by all departments in the course of a month. The economists model takes the form: Because the fitted curve is a production function, it represents the ideal output level that could be achieved for any choice of inputs. Thus, the notion is to fit the model to actual data as well as possible, subject to the requirement that the predicted value be at least as large as the observed value for each combination of inputs in the data set.
Now it is visible.
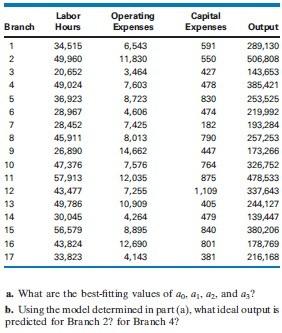
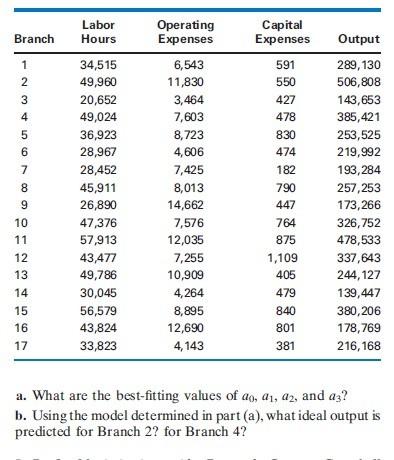
Branch Labor Hours Output 2 3 4 5 6 7 8 9 34,515 49,960 20,652 49,024 36,923 28,967 28,452 45,911 26,890 47,376 57,913 43,477 49,786 30.045 56,579 43,824 33,823 Operating Expenses 6,543 11,830 3,464 7.603 8,723 4,606 7,425 8,013 14,662 7,576 12,035 7,255 10,909 4,264 8,895 12,690 4,143 Capital Expenses 591 550 427 478 830 474 182 790 447 764 875 1,109 405 479 840 801 381 289,130 506,808 143,653 385,421 253,525 219,992 193,284 257,253 173,266 326,752 478,533 337,643 244,127 139,447 380,206 178,769 216,168 10 11 12 13 14 15 16 17 a. What are the best-fitting values of as, 41, 42, and az? b. Using the model determined in part(a), what ideal output is predicted for Branch 2? for Branch 4? 4. Curve Fitting with Constraints. A bank's economist has been interested in developing a production function for the bank. The model recognizes three explanatory variables, which are measures of resources available to the bank. These are Labor Hours, Operating Expenses, and Capital Expenses. The response variable, which measures output activity, is a weighted average of the transactions processed by all departments in the course of a month. The economist's model takes the form: Q = 80%**** Because the fitted curve is a production function, it represents the ideal output level that could be achieved for any choice of inputs. Thus, the notion is to fit the model to actual data as well as possible, subject to the requirement that the predicted value be at least as large as the observed value for each combination of inputs in the data set. Labor Hours Branch Capital Expenses 1 591 AWN 5 6 7 8 9 10 11 12 13 14 15 16 17 34,515 49,960 20,652 49,024 36,923 28,967 28,452 45,911 26,890 47,376 57,913 43,477 49,786 30,045 56,579 43,824 33,823 Operating Expenses 6,543 11,830 3,464 7,603 8,723 4,606 7,425 8,013 14,662 7,576 12,035 7,255 10,909 4,264 8,895 12,690 4,143 550 427 478 830 474 182 790 447 764 875 1,109 405 479 840 801 381 Output 289, 130 506,808 143,653 385,421 253,525 219,992 193,284 257,253 173,266 326,752 478,533 337,643 244,127 139,447 380,206 178,769 216,168 a. What are the best-fitting values of 0, 41, 42, and ag? b. Using the model determined in part (a), what ideal output is predicted for Branch 2? for Branch 4Step by Step Solution
There are 3 Steps involved in it

Get step-by-step solutions from verified subject matter experts