

Question: Old MathJax webview This is the question Mower Unit Sales below Tractor Unit Sales below This is a more clearer way to ask about what
Old MathJax webview

This is the question
Mower Unit Sales below
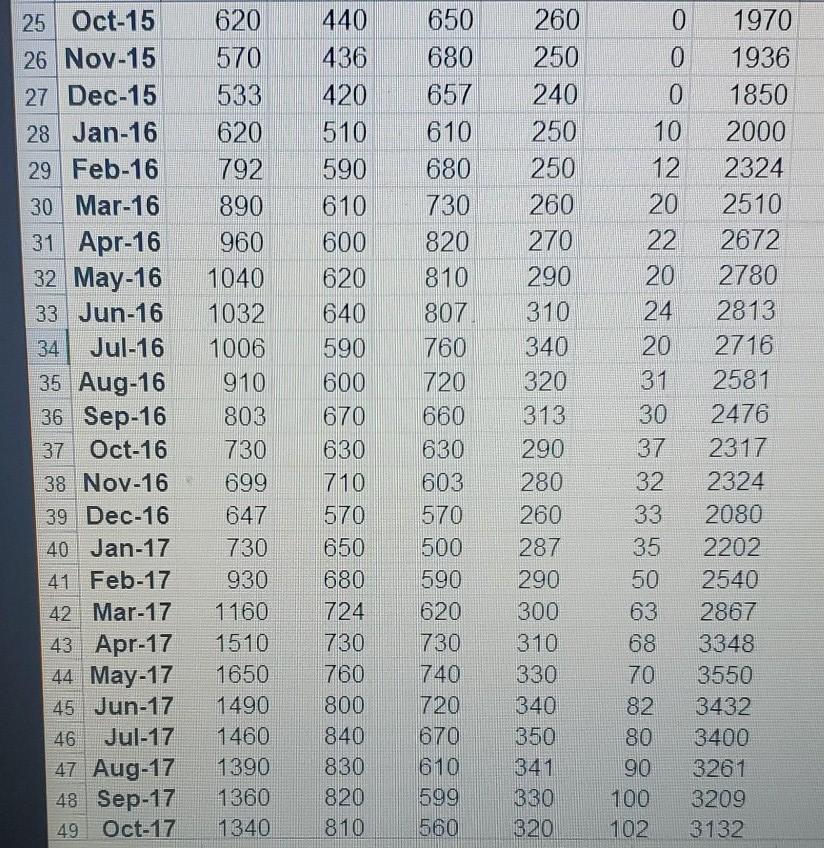
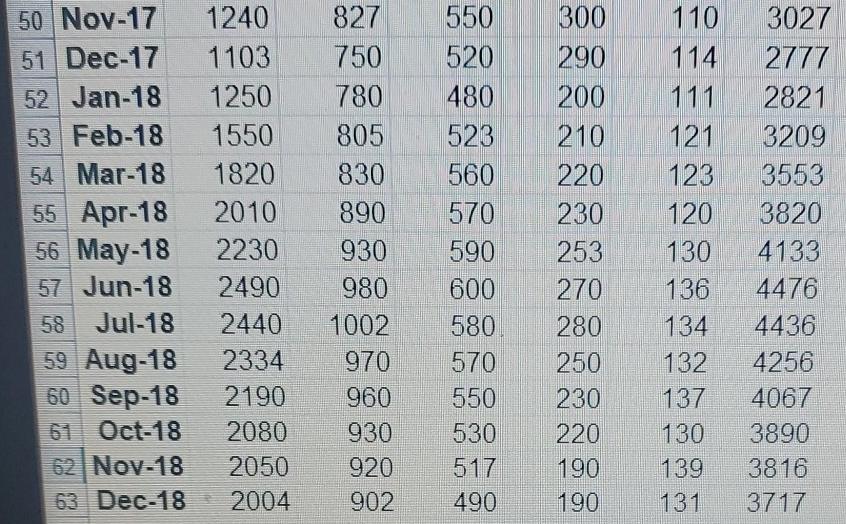
Tractor Unit Sales below

This is a more clearer way to ask about what I need.
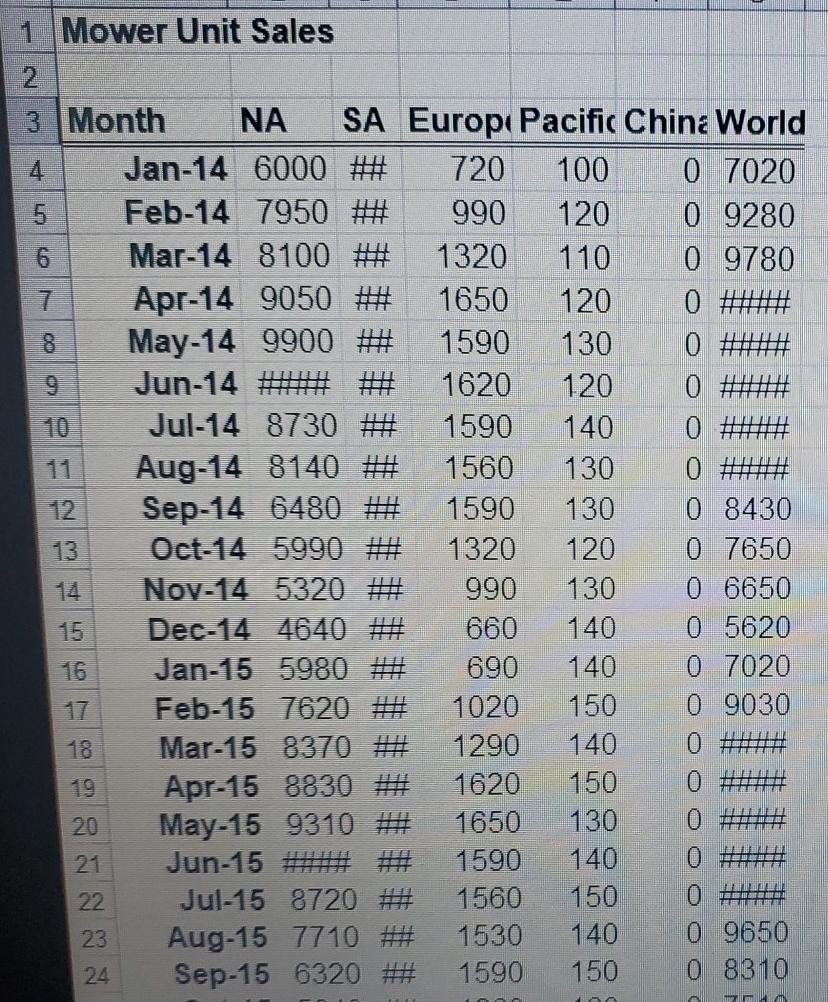
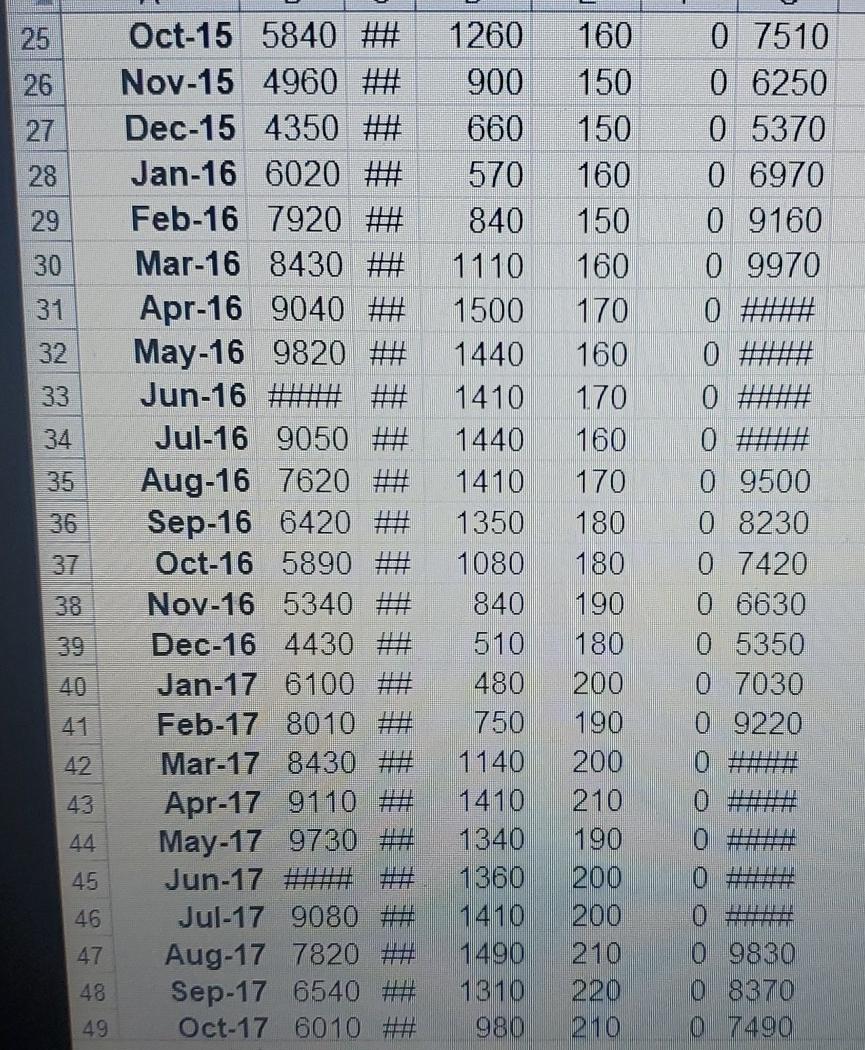
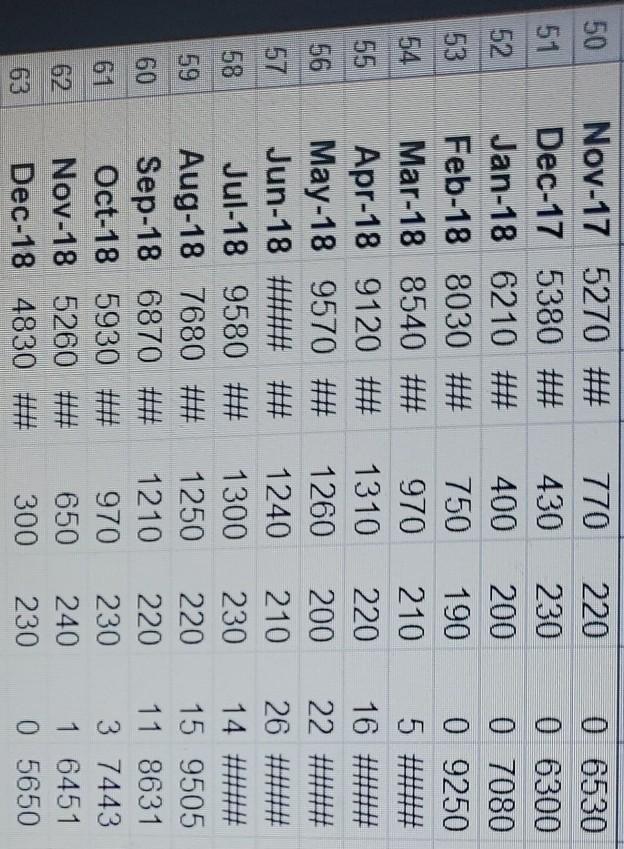
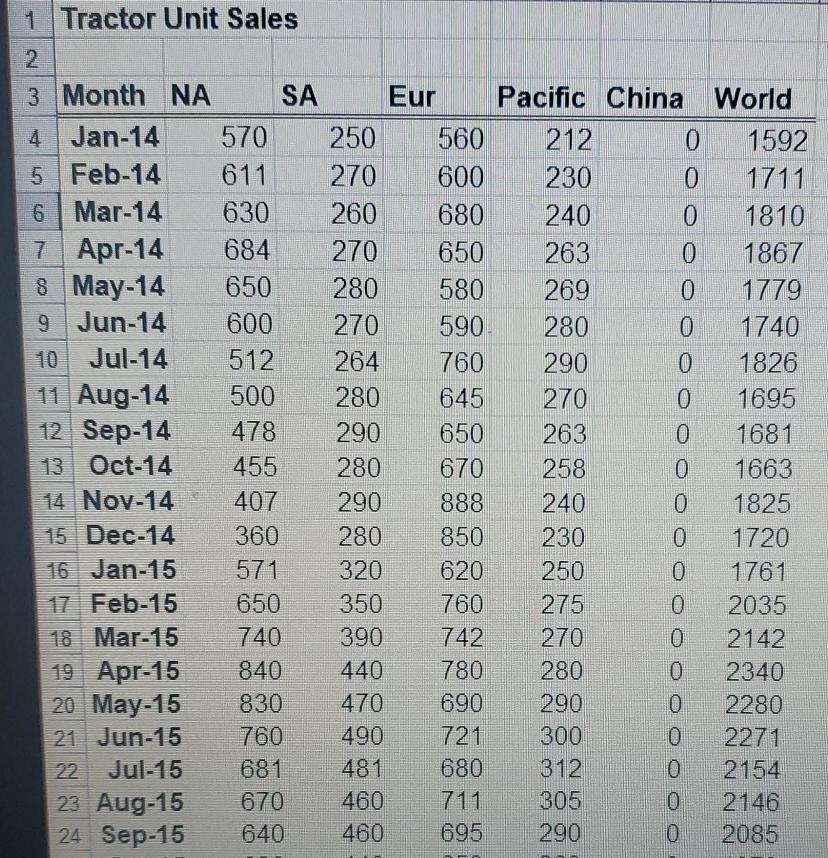
Create a new worksheet to compute gross revenues by month and region, as well as worldwide totals, for each product using the data in Mower Unit Sales and Tractor Unit Sales. 1 Mower Unit Sales 4 5 7 2 3 Month NA SA Europi Pacific China World Jan-14 6000 ## 720 100 0 7020 Feb-14 7950 ## 990 120 0 9280 6 Mar-14 8100 ## 1320 110 0 9780 Apr-14 9050 ## 1650 120 0 May-14 9900 ## 1590 130 0 Jun-14 1620 120 0 Jul-14 8730 ## 1590 140 0 11 Aug-14 8140 ## 1560 130 0 12 Sep-14 6480 # 1590 130 0 8430 13 Oct-14 5990 ## 1320 120 0 7650 Nov-14 5320 ## 990 130 0 6650 15 Dec-14 4640 ## 660 140 0 5620 16 Jan-15 5980 690 140 0 7020 Feb-15 7620 ## 1020 150 0 9030 18 Mar-15 8370 ## 1290 140 0 19 Apr-15 8830 ## 1620 150 20 May-15 9310 1650 130 0 21 Jun-15 ### ## 1590 140 22 Jul-15 8720 ## 1560 150 0 23 Aug-15 7710 ## 1530 140 0 9650 24 Sep-15 6320 ## 1590 150 0 8310 25 Oct-15 5840 ### 1260 160 0 7510 26 Nov-15 4960 ## 900 150 0 6250 27 Dec-15 4350 ## 660 150 0 5370 28 Jan-16 6020 ## 570 160 0 6970 29 Feb-16 7920 ## 840 150 30 Mar-16 8430 ## 1110 160 0 9160 0 9970 0 31 1500 170 32 Apr-16 9040 ## May-16 9820 ## Jun-16 1440 160 0 33 1410 170 0 34 Jul-16 9050 ## 1440 160 0 ## 1410 170 36 1350 37 1080 0 9500 0 8230 0 7420 0 6630 0 5350 38 840 510 480 750 Aug-16 7620 ## Sep-16 6420 Oct-16 5890 Nov-16 5340 Dec-16 4430 Jan-17 6100 Feb-17 8010 ## Mar-17 8430 ## Apr-17 9110 ## May-17 9730 ## Jun-17 ## ## Jul-17 9080 ## Aug-17 7820 ## Sep-17 6540 ## Oct-17 6010 ## 0 7030 0 9220 0 42 180 180 190 180 200 190 200 210 190 200 200 210 220 210 43 44 1140 1410 1340 1360 1410 1490 1310 980 45 *** 46 0 0 0 0 9830 0 8370 0 7490 47 48 49 770 220 430 230 0 6530 0 6300 0 7080 0 9250 400 200 750 190 970 210 5 ## 1310 220 50 Nov-17 5270 ## 51 Dec-17 5380 ## 52 Jan-18 6210 ## 53 Feb-18 8030 # 54 Mar-18 8540 ## 55 Apr-18 9120 ## 56 May-18 9570 ## 57 Jun-18 ## ## 58 Jul-18 9580 ## 59 Aug-18 7680 ## 60 Sep-18 6870 ## 61 Oct-18 5930 ## Nov-18 5260 63 Dec-18 4830 ## 16 # 22 1260 200 1240 210 26 ### 1300 14 230 220 15 9505 1250 1210 970 220 11 8631 230 3 7443 650 240 1 6451 300 230 0 5650 1 Tractor Unit Sales 2 3 Month NA SA Eur Pacific China World 4 Jan-14 570 250 560 212 0 1592 5 Feb-14 611 270 600 230 0 1711 6 Mar-14 630 260 680 240 0 1810 7 Apr-14 684 270 650 263 0 1867 8 May-14 650 280 580 269 0 1779 9 Jun-14 600 270 590 280 0 1740 Jul-14 512 264 760 290 0 1826 11 Aug-14 500 280 645 270 0 1695 12 Sep-14 478 290 650 263 0 1681 13 Oct.14 455 280 670 258 0 1663 14 Noy-14 407 290 888 240 0 1825 15 Dec-14 360 280 850 230 0 1720 16 Jan-15 571 320 620 250 0 1761 17 Feb-15 650 350 760 275 0 2035 18 Mar-15 740 390 742 270 2142 19 Apr-15 840 440 780 280 0 2340 20 May-15 830 470 690 290 0 2280 21 Jun-15 760 490 721 300 2271 Jul-15 681 481 680 312 0 2154 23 Aug-15 670 460 305 0 2146 24 Sep-15 640 460 695 290 0 2085 620 650 260 0 1970 570 440 436 420 680 250 0 1936 657 0 1850 533 620 240 250 610 10 2000 510 590 792 680 250 12 2324 890 610 730 20 960 600 820 22 2510 2672 2780 2813 620 810 20 640 807 260 270 290 310 340 320 313 24 1040 1032 1006 910 803 760 20 25 Oct-15 26 Nov-15 27 Dec-15 28 Jan-16 29 Feb-16 30 Mar-16 31 Apr-16 32 May-16 33 Jun-16 34 Jul-16 35 Aug-16 36 Sep-16 37 Oct-16 38 Noy-16 39 Dec-16 40 Jan-17 41 Feb-17 42 Mar-17 43 Apr-17 44 May-17 45 Jun-17 46 Jul-17 47 Aug-17 48 Sep-17 49 Oct-17 2716 2581 720 590 600 670 630 660 31 30 37 2476 730 630 290 710 280 260 2317 2324 2080 699 647 730 930 603 570 500 590 570 650 680 724 730 2202 32 33 35 50 63 287 290 1160 620 2540 2867 3348 1510 730 68 1650 760 740 70 3550 82 3432 1490 1460 800 840 830 820 810 1390 1360 1340 300 310 330 340 350 341 330 320 720 670 610 599 560 80 90 100 102 3400 3261 3209 3132 1240 550 300 110 3027 1103 827 750 780 2777 520 480 523 560 290 200 210 220 1250 1550 1820 2010 114 111 121 123 2821 3209 805 830 890 570 230 120 50 Nov-17 51 Dec-17 52 Jan-18 53 Feb-18 54 Mar-18 55 Apr-18 56 May-18 57 Jun-18 58 Jul-18 59 Aug-18 60 Sep-18 61 Oct 18 62 Noy-18 63 Dec-18 2230 930 590 253 130 3553 3820 4133 4476 4436 2490 600 136 980 1002 270 280 2440 580 134 2334 970 570 250 132 4256 960 230 137 4067 550 530 930 3890 2190 2080 2050 2004 920 517 220 190 190 130 139 131 3816 3717 902 490 ross revenues by month and region, as well as worldwide totals, for each product using the data in Mower Unit Sales and Tractor Unit Sales. Create a new worksheet titled "Gross Profit". Using the information in the table above combined with the sales information from the data in the "Mower Unit Sales" and "Tractor Unit Sales" calculate gross profit for each month for each region and the world. Create a new worksheet to compute gross revenues by month and region, as well as worldwide totals, for each product using the data in Mower Unit Sales and Tractor Unit Sales. 1 Mower Unit Sales 4 5 7 2 3 Month NA SA Europi Pacific China World Jan-14 6000 ## 720 100 0 7020 Feb-14 7950 ## 990 120 0 9280 6 Mar-14 8100 ## 1320 110 0 9780 Apr-14 9050 ## 1650 120 0 May-14 9900 ## 1590 130 0 Jun-14 1620 120 0 Jul-14 8730 ## 1590 140 0 11 Aug-14 8140 ## 1560 130 0 12 Sep-14 6480 # 1590 130 0 8430 13 Oct-14 5990 ## 1320 120 0 7650 Nov-14 5320 ## 990 130 0 6650 15 Dec-14 4640 ## 660 140 0 5620 16 Jan-15 5980 690 140 0 7020 Feb-15 7620 ## 1020 150 0 9030 18 Mar-15 8370 ## 1290 140 0 19 Apr-15 8830 ## 1620 150 20 May-15 9310 1650 130 0 21 Jun-15 ### ## 1590 140 22 Jul-15 8720 ## 1560 150 0 23 Aug-15 7710 ## 1530 140 0 9650 24 Sep-15 6320 ## 1590 150 0 8310 25 Oct-15 5840 ### 1260 160 0 7510 26 Nov-15 4960 ## 900 150 0 6250 27 Dec-15 4350 ## 660 150 0 5370 28 Jan-16 6020 ## 570 160 0 6970 29 Feb-16 7920 ## 840 150 30 Mar-16 8430 ## 1110 160 0 9160 0 9970 0 31 1500 170 32 Apr-16 9040 ## May-16 9820 ## Jun-16 1440 160 0 33 1410 170 0 34 Jul-16 9050 ## 1440 160 0 ## 1410 170 36 1350 37 1080 0 9500 0 8230 0 7420 0 6630 0 5350 38 840 510 480 750 Aug-16 7620 ## Sep-16 6420 Oct-16 5890 Nov-16 5340 Dec-16 4430 Jan-17 6100 Feb-17 8010 ## Mar-17 8430 ## Apr-17 9110 ## May-17 9730 ## Jun-17 ## ## Jul-17 9080 ## Aug-17 7820 ## Sep-17 6540 ## Oct-17 6010 ## 0 7030 0 9220 0 42 180 180 190 180 200 190 200 210 190 200 200 210 220 210 43 44 1140 1410 1340 1360 1410 1490 1310 980 45 *** 46 0 0 0 0 9830 0 8370 0 7490 47 48 49 770 220 430 230 0 6530 0 6300 0 7080 0 9250 400 200 750 190 970 210 5 ## 1310 220 50 Nov-17 5270 ## 51 Dec-17 5380 ## 52 Jan-18 6210 ## 53 Feb-18 8030 # 54 Mar-18 8540 ## 55 Apr-18 9120 ## 56 May-18 9570 ## 57 Jun-18 ## ## 58 Jul-18 9580 ## 59 Aug-18 7680 ## 60 Sep-18 6870 ## 61 Oct-18 5930 ## Nov-18 5260 63 Dec-18 4830 ## 16 # 22 1260 200 1240 210 26 ### 1300 14 230 220 15 9505 1250 1210 970 220 11 8631 230 3 7443 650 240 1 6451 300 230 0 5650 1 Tractor Unit Sales 2 3 Month NA SA Eur Pacific China World 4 Jan-14 570 250 560 212 0 1592 5 Feb-14 611 270 600 230 0 1711 6 Mar-14 630 260 680 240 0 1810 7 Apr-14 684 270 650 263 0 1867 8 May-14 650 280 580 269 0 1779 9 Jun-14 600 270 590 280 0 1740 Jul-14 512 264 760 290 0 1826 11 Aug-14 500 280 645 270 0 1695 12 Sep-14 478 290 650 263 0 1681 13 Oct.14 455 280 670 258 0 1663 14 Noy-14 407 290 888 240 0 1825 15 Dec-14 360 280 850 230 0 1720 16 Jan-15 571 320 620 250 0 1761 17 Feb-15 650 350 760 275 0 2035 18 Mar-15 740 390 742 270 2142 19 Apr-15 840 440 780 280 0 2340 20 May-15 830 470 690 290 0 2280 21 Jun-15 760 490 721 300 2271 Jul-15 681 481 680 312 0 2154 23 Aug-15 670 460 305 0 2146 24 Sep-15 640 460 695 290 0 2085 620 650 260 0 1970 570 440 436 420 680 250 0 1936 657 0 1850 533 620 240 250 610 10 2000 510 590 792 680 250 12 2324 890 610 730 20 960 600 820 22 2510 2672 2780 2813 620 810 20 640 807 260 270 290 310 340 320 313 24 1040 1032 1006 910 803 760 20 25 Oct-15 26 Nov-15 27 Dec-15 28 Jan-16 29 Feb-16 30 Mar-16 31 Apr-16 32 May-16 33 Jun-16 34 Jul-16 35 Aug-16 36 Sep-16 37 Oct-16 38 Noy-16 39 Dec-16 40 Jan-17 41 Feb-17 42 Mar-17 43 Apr-17 44 May-17 45 Jun-17 46 Jul-17 47 Aug-17 48 Sep-17 49 Oct-17 2716 2581 720 590 600 670 630 660 31 30 37 2476 730 630 290 710 280 260 2317 2324 2080 699 647 730 930 603 570 500 590 570 650 680 724 730 2202 32 33 35 50 63 287 290 1160 620 2540 2867 3348 1510 730 68 1650 760 740 70 3550 82 3432 1490 1460 800 840 830 820 810 1390 1360 1340 300 310 330 340 350 341 330 320 720 670 610 599 560 80 90 100 102 3400 3261 3209 3132 1240 550 300 110 3027 1103 827 750 780 2777 520 480 523 560 290 200 210 220 1250 1550 1820 2010 114 111 121 123 2821 3209 805 830 890 570 230 120 50 Nov-17 51 Dec-17 52 Jan-18 53 Feb-18 54 Mar-18 55 Apr-18 56 May-18 57 Jun-18 58 Jul-18 59 Aug-18 60 Sep-18 61 Oct 18 62 Noy-18 63 Dec-18 2230 930 590 253 130 3553 3820 4133 4476 4436 2490 600 136 980 1002 270 280 2440 580 134 2334 970 570 250 132 4256 960 230 137 4067 550 530 930 3890 2190 2080 2050 2004 920 517 220 190 190 130 139 131 3816 3717 902 490 ross revenues by month and region, as well as worldwide totals, for each product using the data in Mower Unit Sales and Tractor Unit Sales. Create a new worksheet titled "Gross Profit". Using the information in the table above combined with the sales information from the data in the "Mower Unit Sales" and "Tractor Unit Sales" calculate gross profit for each month for each region and the world
Step by Step Solution
There are 3 Steps involved in it

Get step-by-step solutions from verified subject matter experts