

Question: ome Insert Draw Design Layout >> Tell me Comments Editing LE Share b) (Worth 15%) Fill in the blanks to estimate the statistical model. For
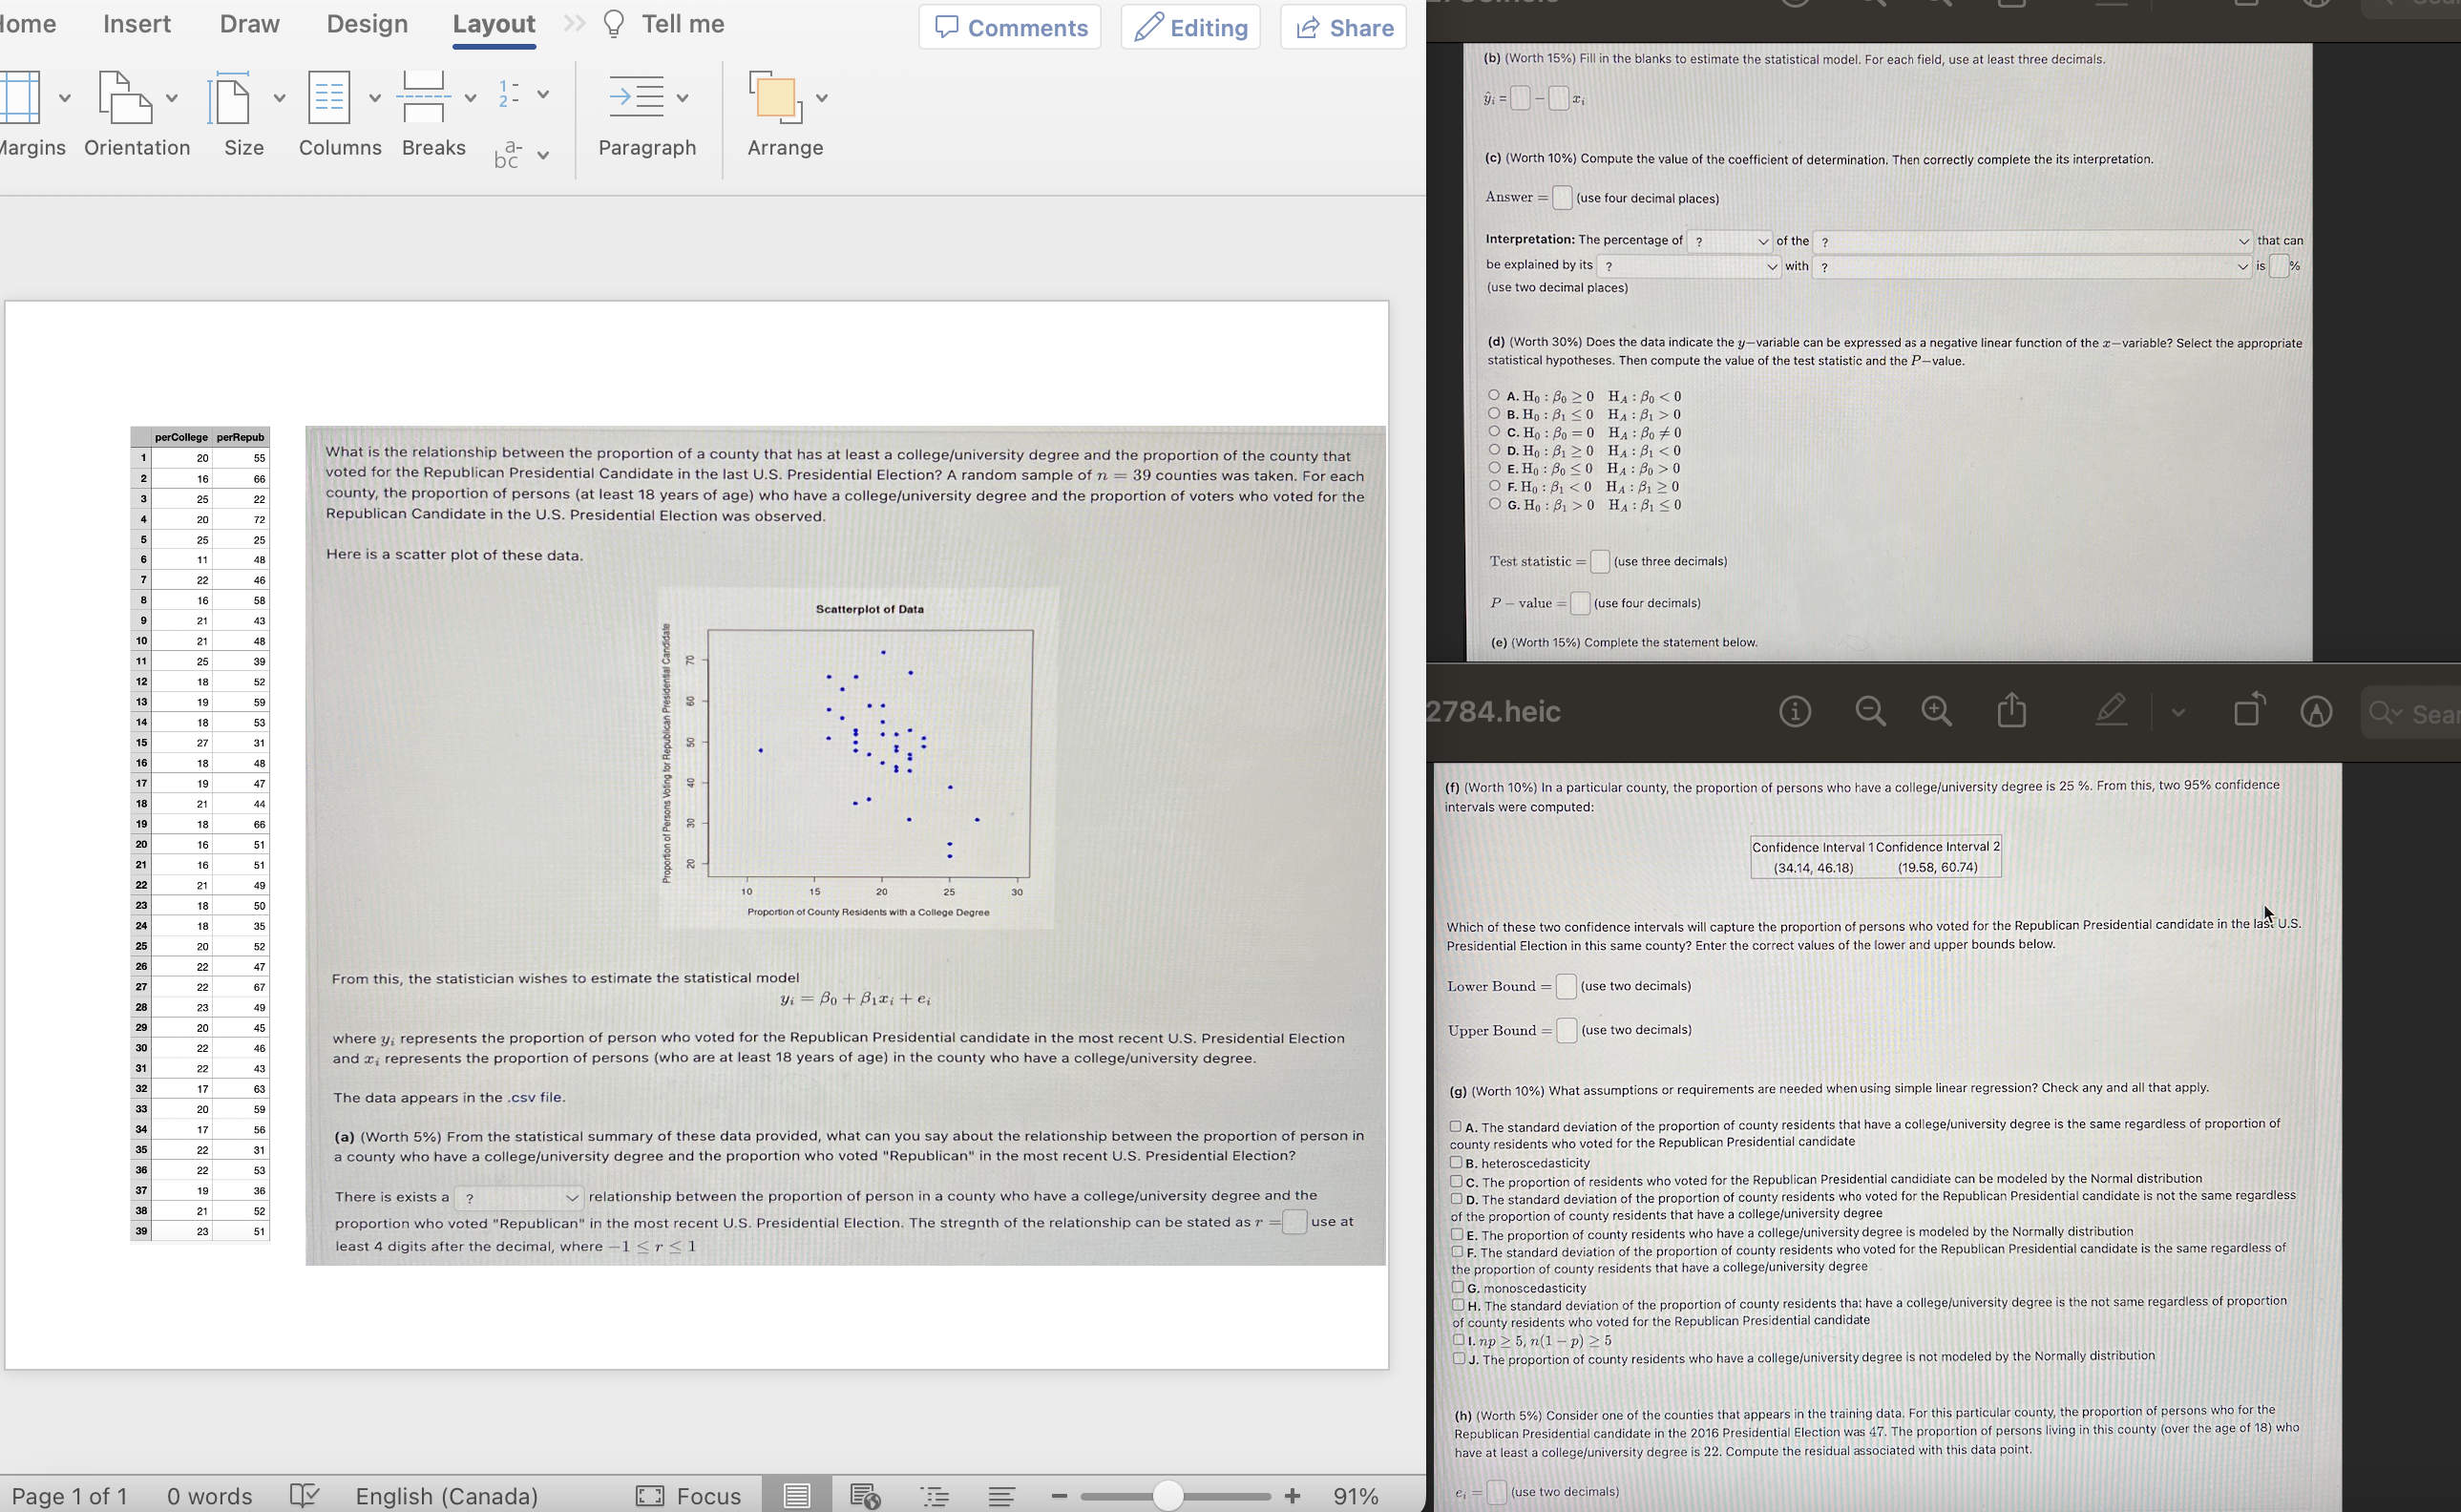
ome Insert Draw Design Layout >> Tell me Comments Editing LE Share b) (Worth 15%) Fill in the blanks to estimate the statistical model. For each field, use at least three decimals. EE 2: v largins Orientation Size Columns Breaks Paragraph Arrange (c) (Worth 10%) Compute the value of the coefficient of determination. Then correctly complete the its interpretation. Answer = (use four decimal places) Interpretation: The percentage of ? of the ? that can be explained by its ? with ? is % (use two decimal places) (d) (Worth 30%) Does the data indicate the y-variable can be expressed as a negative linear function of the x-variable? Select the appropriate statistical hypotheses. Then compute the value of the test statistic and the P-value O A. Ho : Bo 2 0 HA : Bo 0 perCollege perRepub O C. Ho : Bo = 0 HA : Bo # 0 20 55 What is the relationship between the proportion of a county that has at least a college/university degree and the proportion of the county that O D. Ho : B1 2 0 HA : BI 0 county, the proportion of persons (at least 18 years of age) who have a college/university degree and the proportion of voters who voted for the O F. Ho : B1 O HA : B1 SO Here is a scatter plot of these data. Test statistic = (use three decimals) 58 Scatterplot of Data P - value = (use four decimals) (e) (Worth 15%) Complete the statement below. 70 2784.heic 50 60 Q Sea Proportion of Persons Voting for Republican Presidential Candidate (f) (Worth 10%) In a particular county, the proportion of persons who have a college/university degree is 25 %. From this, two 95% confidence intervals were computed: 20 30 40 Confidence Interval 1 Confidence Interval 2 (34.14, 46.18) (19.58, 60.74) 10 15 20 25 30 Proportion of County Residents with a College Degree Which of these two confidence intervals will capture the proportion of persons who voted for the Republican Presidential candidate in the last U.S. Presidential Election in this same county? Enter the correct values of the lower and upper bounds below. From this, the statistician wishes to estimate the statistical model yi = Bo+ Bititei Lower Bound = (use two decimals) where y; represents the proportion of person who voted for the Republican Presidential candidate in the most recent U.S. Presidential Election Upper Bound = (use two decimals) and ; represents the proportion of persons (who are at least 18 years of age) in the county who have a college/university degree. The data appears in the .csv file (9) (Worth 10%) What assumptions or requirements are needed when using simple linear regression? Check any and all that apply. (a) (Worth 5%) From the statistical summary of these data provided, what can you say about the relationship between the proportion of person in A. The standard deviation of the proportion of county residents that have a college/university degree is the same regardless of proportion of a county who have a college/university degree and the proportion who voted "Republican" in the most recent U.S. Presidential Election? county residents who voted for t DB. heterosced OC. The proportion of residents who voted for the Republican Presidential candidate can be modeled by the Normal distribution There is exists a ? relationship between the proportion of person in a county who have a college/university degree and the D. The standard deviation of the proportion of county residents who voted for the Republican Presidential candidate is not the same regardless proportion who voted "Republican" in the most recent U.S. Presidential Election. The stregnth of the relationship can be stated as r =|use at of the proportion of county residents that have a college/university degree east 4 digits after the decimal, where -1
Step by Step Solution
There are 3 Steps involved in it

Get step-by-step solutions from verified subject matter experts